Uppal is a suburb of Hyderabad, located in the northeastern part of the city. It is known for housing landmarks like the Rajiv Gandhi International Cricket Stadium and has schools, government offices, industrial zones and commercial centres. The area experiences high temperatures due to the Urban Heat Island (UHI) effect that operates within the city limits.
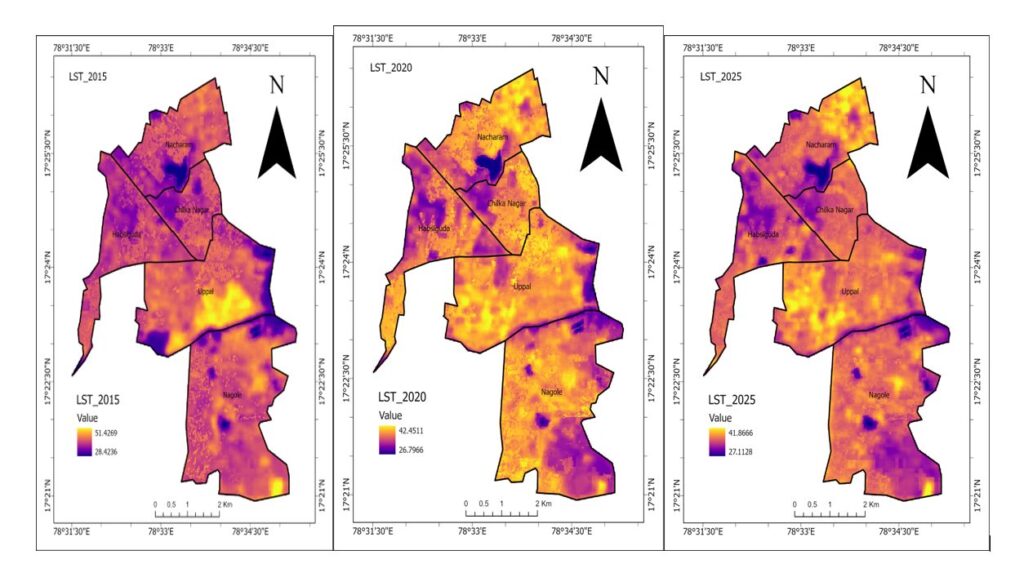
Our examination of Land Surface Temperature (LST) data covered the years 2015, 2020, and 2025 and shows how heat zones have expanded with warmer areas becoming larger. In Uppal, rapid urban development has changed the thermal balance. Dense construction and fewer trees are creating persistent heat hotspots. With limited green spaces, the local thermal environment seems to have experienced permanent changes.
In the datajam organised by OpenCity in collaboration with the International Institute of Information Technology, Hyderabad, we conducted a heat-risk assessment to investigate this pattern more effectively. The framework includes three essential elements that consist of UHI intensity hazards measured through LST, population vulnerability assessment and evaluation of possible effects on productivity and human activities. This method establishes an urban heat risk assessment framework for Uppal through spatial analysis and data assessment that supports efficient planning operations.
How temperatures changed over time
The temporal analysis of Land Surface Temperature (LST) shows a thermal profile transformation of Uppal from 2015 to 2025. The spatial distribution of temperature shows that areas which were previously moderate have gradually transitioned into higher temperature zones.
In 2015, high-temperature regions existed as scattered and limited areas. The zones expanded across built-up areas which experienced increased development by 2020.
What is causing the heat?
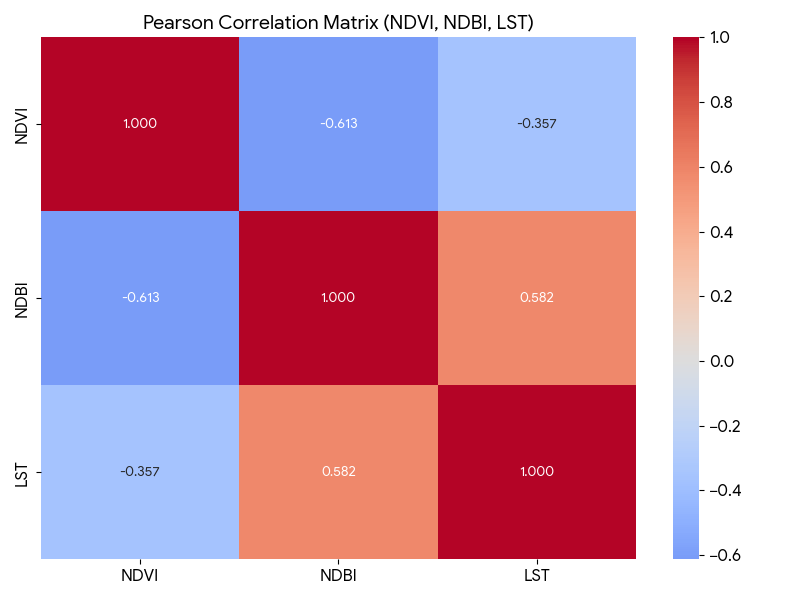
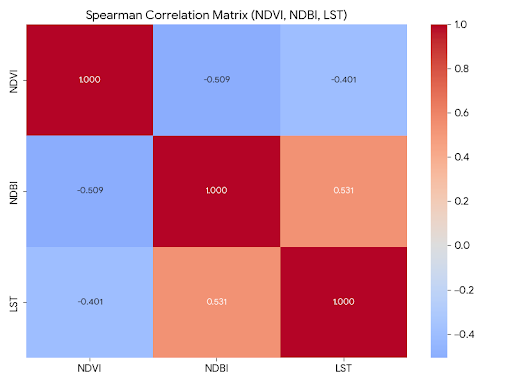
Team members used correlation analysis to study the relationship between Land Surface Temperature (LST), vegetation cover (NDVI) and built-up density (NDBI) to identify the causes for increasing temperatures in Uppal. The results demonstrate a consistent relationship between these two variables.
The negative correlation between vegetation and LST indicates that green areas experience complete surface temperature reduction. The cooling effect of vegetation is demonstrated through its dual functions of providing shade and releasing moisture through evaporation.
Read more: Scorching streets: Understanding urban heat islands in Bengaluru’s market areas
The positive correlation between LST and built-up density shows that areas with high infrastructure development and non-permeable surfaces create conditions which produce and sustain additional heat. The Pearson and Spearman correlation matrices show the same patterns which demonstrate these connections between variables that have important structural relationships. The strength of these correlations shows that thermal conditions undergo direct alteration due to changes in land use patterns.
The analysis shows that urban heat in Uppal results from two primary factors which include reduced vegetation and increased development/concretisation. The findings emphasise the need for urban planning methods which promote ecological restoration in developed areas.
Heat risk mapping
Temperature maps display heat distribution, but thermal risk mapping offers more detailed results through its ability to determine areas which face the highest risk. Uppal risk maps use heat intensity,exposure and vulnerability information to establish risk categories that range from very low to very high risk.
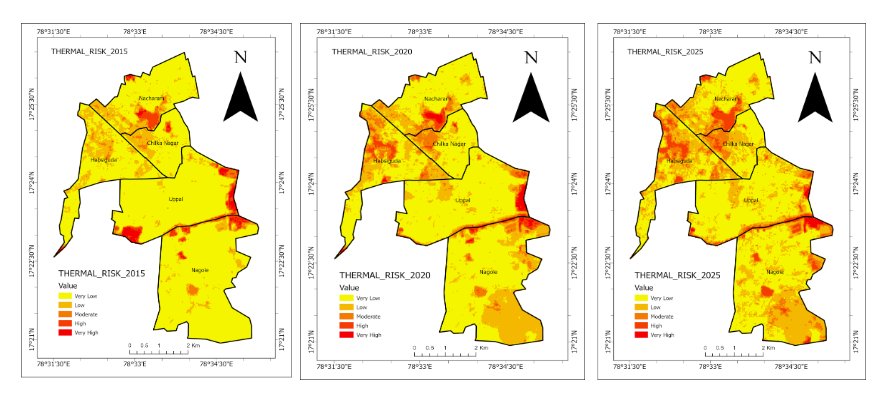
The three years display an obvious pattern that shows different stages of development. The high-risk zones in 2015 showed a limited presence. The zones expanded their boundaries between 2020 and 2025, especially in regions which experienced a surge of urban development. The maps show that moderate to high-risk areas have expanded between 2025, while some regions continue to experience high risk.
The current development shows that the heat conditions have worsened and more people are now vulnerable. High-risk zones exist primarily in areas with multiple structures, but places with extensive vegetation show a lower risk level.
Thermal risk assessment like this enables effective planning because it enables planners to assess specific temperature patterns which make specific locations vulnerable. The system allows decision-makers to identify areas which need intervention and it helps them create specific plans which reduce heat exposure at the ward level.
Impact and policy
The heat risk assessment results show that Hyderabad needs to implement data-driven urban planning methods. The city needs to implement targeted solutions which address specific areas because urban heat patterns operate throughout the city. The study shows that heat-sensitive zoning areas require special consideration.
Planning in high-risk areas needs to include mandatory green cover requirements while balancing development. Such a process will help to decrease ongoing thermal stress while slowing the growth of hotspots. The development of blue-green infrastructure functions as a primary environmental protection method.
The combination of tree planting, water body restoration, and permeable surface establishment will create major temperature reduction effects and improve local climate conditions. These systemic improvements will also enhance water conservation and maintain natural ecosystem equilibrium.
The combination of cool roofs with reflective surface provides urban areas with immediate practical solutions. These measures will also result in lower indoor temperatures and better living conditions.
Our study proves that ward-level intervention methods are vital components that enable successful climate adaptation.