Urban biodiversity is often discussed in terms of tree cover, lakes, or flagship species, but far less attention is paid to pollinators—the insects and birds that quietly sustain urban ecosystems. In Bengaluru, a rapidly urbanising city with a strong culture of citizen science, large volumes of biodiversity data are now being generated by the public. But what does this data tell us about pollinators in the city?
This article draws from a data jam hosted by OpenCity in Bengaluru that explored pollinator observations using publicly available, citizen-generated datasets. By analysing long-term observation records and spatial data on land use and vegetation, the study asks a simple but important question: where are the pollinators, and how well are we actually observing them?
Data sources and approach
The analysis relied entirely on open datasets generated through citizen participation:
- iNaturalist observations (2006–2025), providing records of insects and birds reported by citizens over nearly two decades
- eBird data (2016–2025), focusing on bird species known to act as pollinators.
- Land Use and Land Cover (LULC) data from the European Space Agency (2015–2021), used to understand changes in vegetation and water cover across the city.
Pollinators were broadly categorised to include bees, butterflies, moths, wasps, and select bird species such as sunbirds and flowerpeckers. Trends were analysed across time, geography and land-cover types to understand both observation patterns and ecological signals.
Read more: What citizen scientists tell us about Bengaluru’s biodiversity
Pollinator observations over time
One of the clearest patterns to emerge from the data is a sharp increase in pollinator observations over time. From 2006 to 2025, total observations of insects and birds on iNaturalist rose dramatically, with especially steep growth after 2016.
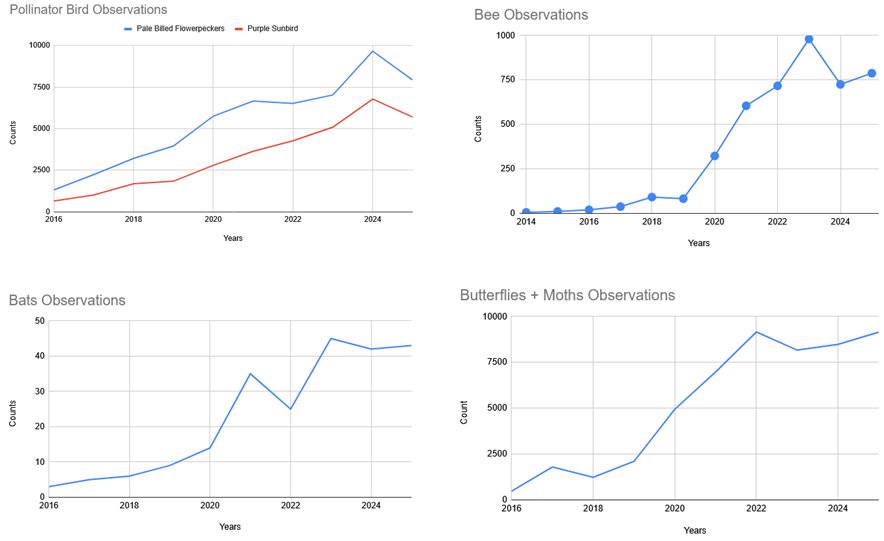
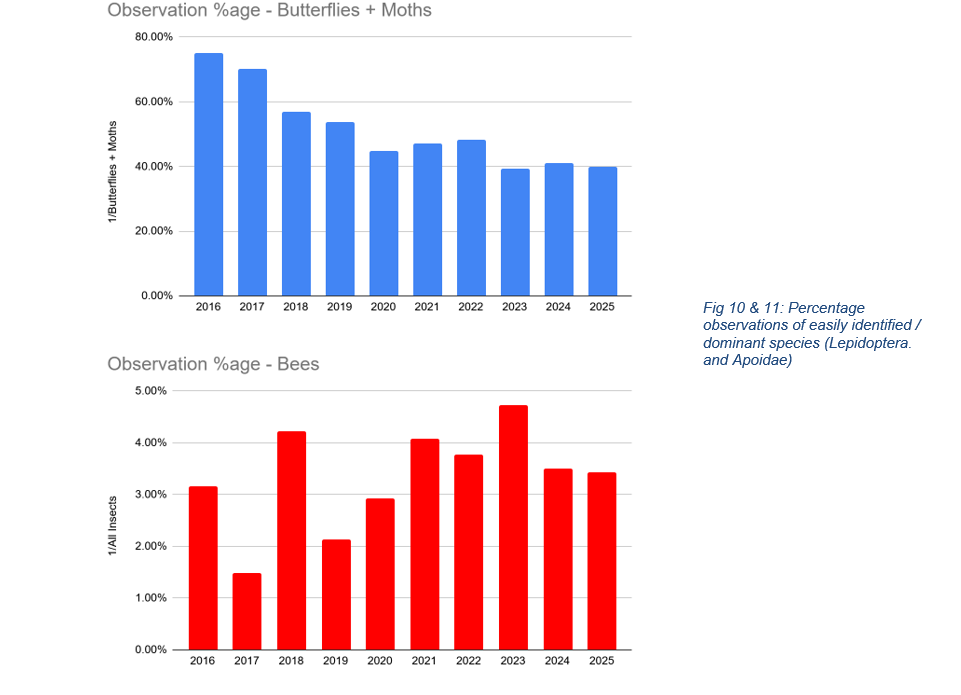
Butterflies and moths (order Lepidoptera) dominate the dataset, consistently accounting for a large proportion of insect observations. Bees (superfamily Apoidea) form a much smaller fraction, typically under five percent of total insect records in most years. Bird pollinators, including species such as the Purple Sunbird and Pale-billed Flowerpecker, also show increasing observation counts over time.
It must be noted, however, that this rise in observations does not necessarily imply an increase in pollinator populations. Instead, it strongly reflects the growing participation of citizens on platforms like iNaturalist and eBird, improved smartphone access, and greater public interest in biodiversity documentation.
Spatial patterns across the city
When mapped across Bengaluru, pollinator observations cluster strongly around areas with higher vegetation cover. Parks, institutional campuses, and greener residential pockets show noticeably higher densities of recorded sightings.
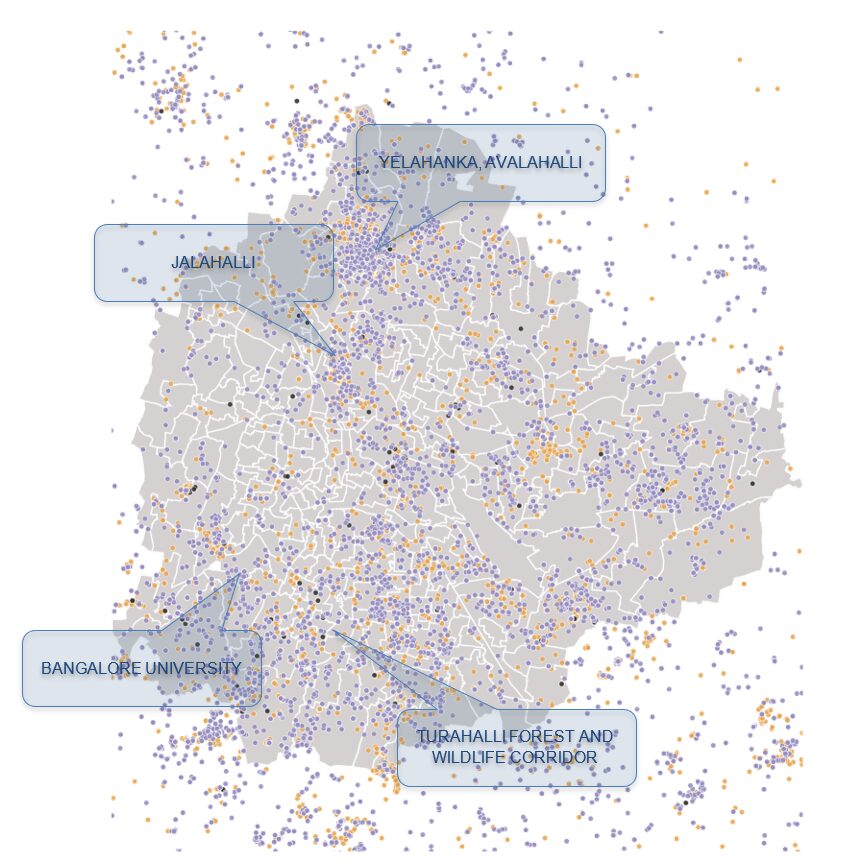
In contrast, proximity to water bodies does not appear to have a strong relationship with pollinator observations. While lakes are important urban ecological features, the data suggests that vegetation cover is a more significant driver of observed pollinator presence than surface water alone.
These spatial patterns highlight how even fragmented green spaces within a dense city can act as important habitats for pollinators.
Land use change and species diversity
Between 2015 and 2021, Bengaluru experienced visible changes in land use and green cover. However, the analysis did not show a corresponding, clearly marked change in the number of pollinator species identified during this period.
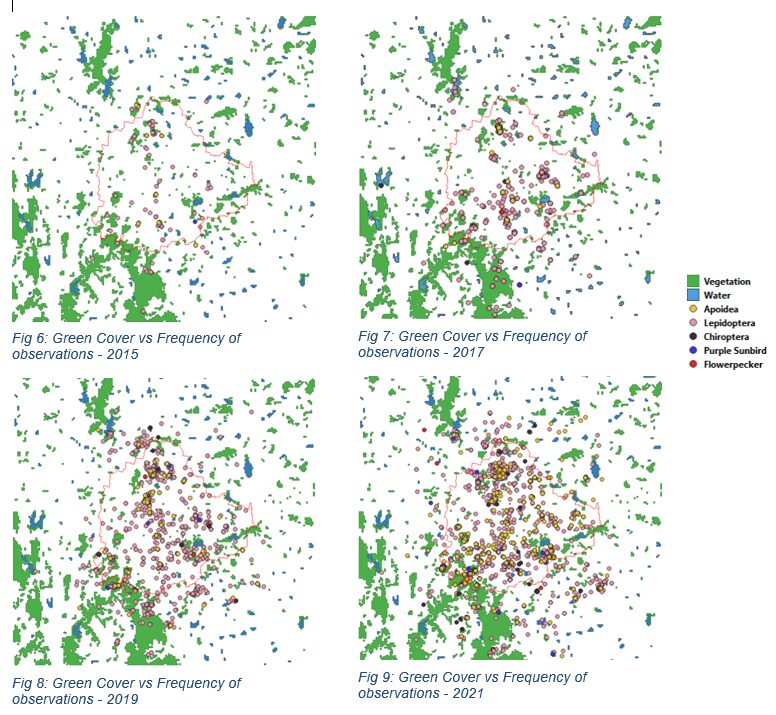
This could indicate several things:
- Pollinator species may be resilient to certain levels of urban change
- The spatial and temporal resolution of citizen data may be insufficient to detect subtle ecological shifts
- Reportage is notable only in green areas and not in other areas as much, which could be indicative of larger biodiversity loss.
- Pollinators may also be dependent on specific plants/trees, whose numbers may also be dwindling, causing the higher concentration of observations in these specific regions
- Observation effort, rather than ecological change, may dominate the dataset
The absence of a clear signal underscores the difficulty of drawing strong ecological conclusions from opportunistic citizen-generated data alone.
Gaps and biases in citizen data
While citizen science datasets are invaluable, the analysis reveals notable gaps. Certain pollinator groups—such as fig wasps—are poorly represented or entirely missing from public datasets. This points to taxonomic bias, where visually striking or easily identifiable species are far more likely to be reported.
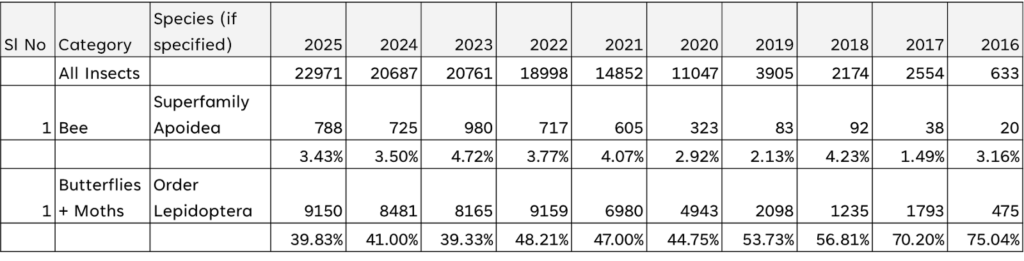
However, there was a visible decline in butterflies and moths as a percentage of the total observations of insects. While such a decline was not seen with bees, they form only three to four percent of the insects observed. This also suggests that the decline in butterflies and moths was not just caused by more observations of other types of insects.
Additionally, increased observations of non-pollinating insect species suggest that rising participation does not automatically translate into better pollinator coverage. What gets recorded is shaped by awareness and accessibility, as much as by ecology.
These limitations do not diminish the value of citizen data, but they do call for careful interpretation.
Why citizen generated data still matters
Despite its biases, citizen-generated biodiversity data offers something traditional surveys often cannot:
- Long time spans
- Fine-grained spatial coverage
- Rapid data accumulation at low cost
In a city like Bengaluru, where formal ecological monitoring is limited, these datasets provide a crucial starting point for understanding urban ecosystems. They also create opportunities to engage citizens not just as observers, but as collaborators in ecological inquiry.
The data jam’s exploration of pollinators in Bengaluru reveals both promise and caution. Pollinator observations are increasing, green spaces emerge as key habitats, and citizen platforms are clearly reshaping how urban biodiversity is documented. At the same time, gaps in coverage and observational bias remind us that data volume is not the same as data completeness.
One approach would be for a narrower set of data with more control parameters, such as dependent flora. Overlaying this with data obtained from greater scientific rigour would help portray a more comprehensive picture on the status of our pollinators. A second approach would be to initiate data and observation activities, on the lines of the Great Backyard Bird Count, focussing on the pollinator species.