Imagine you’re out on a morning walk, phone in hand, when you spot a butterfly you’ve never seen before. You snap a photo, log it into a citizen science app, and voila! You’ve just contributed to crucial biodiversity monitoring. This isn’t just a hobby; it’s part of a global movement where ordinary people collect, record, and sometimes analyse data about plants, animals, and ecosystems.
Citizen science stretches the reach of ecological research. Every observation adds to unique longitudinal datasets that reveal phenology — periodic events in the life cycle of a species — along with species distribution shifts and population trends. Over time, these patterns become powerful stories of change.
When citizen science data is systematically analysed, it can shape conservation planning, influence environmental governance, and ultimately guide decisions that protect the natural world. In other words, your butterfly photo could be a tiny piece of evidence that helps safeguard ecosystems for generations to come.
Major global platforms such as Global Biodiversity Information Facility (GBIF) integrate citizen-generated observations into open databases that support research and conservation planning worldwide. Similarly, long-running initiatives like eBird, managed by the Cornell Lab of Ornithology, demonstrate how volunteer observations can produce scientifically robust datasets used to understand species distribution and migration patterns of birds.
Read more: Pongal Bird Count: What winged friends teach us amidst the urban chaos
Research also shows that citizen science strengthens public awareness and engagement with conservation, creating social as well as ecological benefits.
In urban ecology, citizen science plays an especially important role. Cities are often considered lacking in biodiversity; yet studies show that even heavily built-up urban areas can support diverse species. Because cities are densely populated, they also offer ideal settings for large-scale public participation in citizen-led monitoring of urban biodiversity patterns.
Such findings when carefully analysed not only fill data gaps in fast-changing urban landscapes, but also build environmental literacy and community involvement in conservation. These contributions make citizen science a powerful tool for understanding and sustaining biodiversity in both natural and urban ecosystems.
Patterns of citizen science observations in Bengaluru
As part of the datajam on “Urban Biodiversity in Bengaluru” in December 2025, we examined the spatial and temporal patterns of biodiversity observations by Bengaluru citizens between 2016-2025. This helped identify data-deficient areas, understand taxonomic trends, and explore whether specific ward characteristics influence participation in citizen science.
The study analyzed 1,51,471 research-grade iNaturalist observations and 24,75,607 eBird observations. We assessed observations and observer counts over time, mapped spatial distributions, identified taxonomic trends, and correlated patterns with the characteristics of 243 wards as delimited in 2022.
Patterns of iNaturalist observations
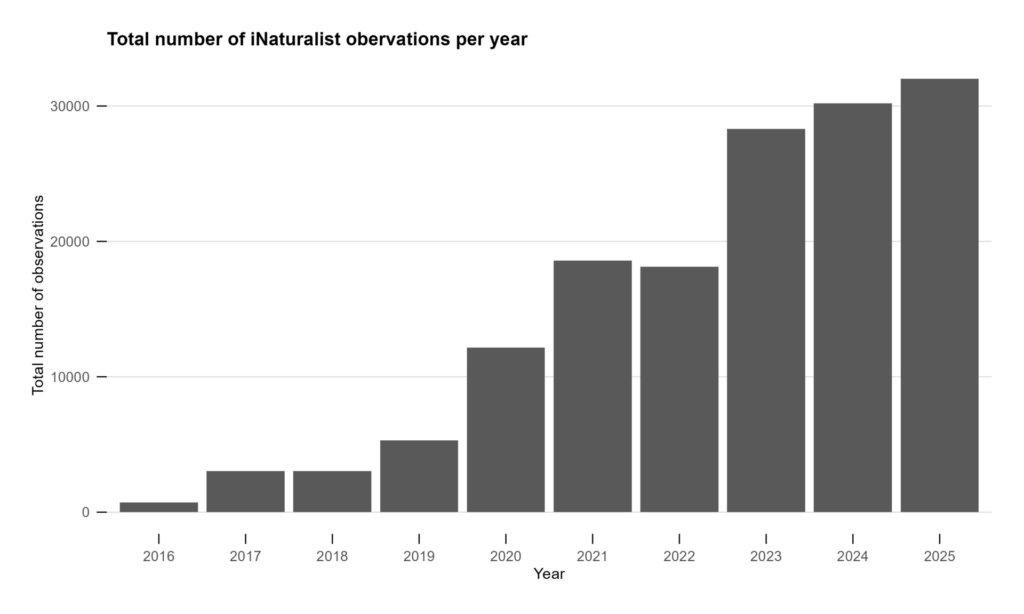
The total number of observations on iNaturalist portal grew rapidly from 719 in 2016 to 32,014 in 2025 (Figure 1).
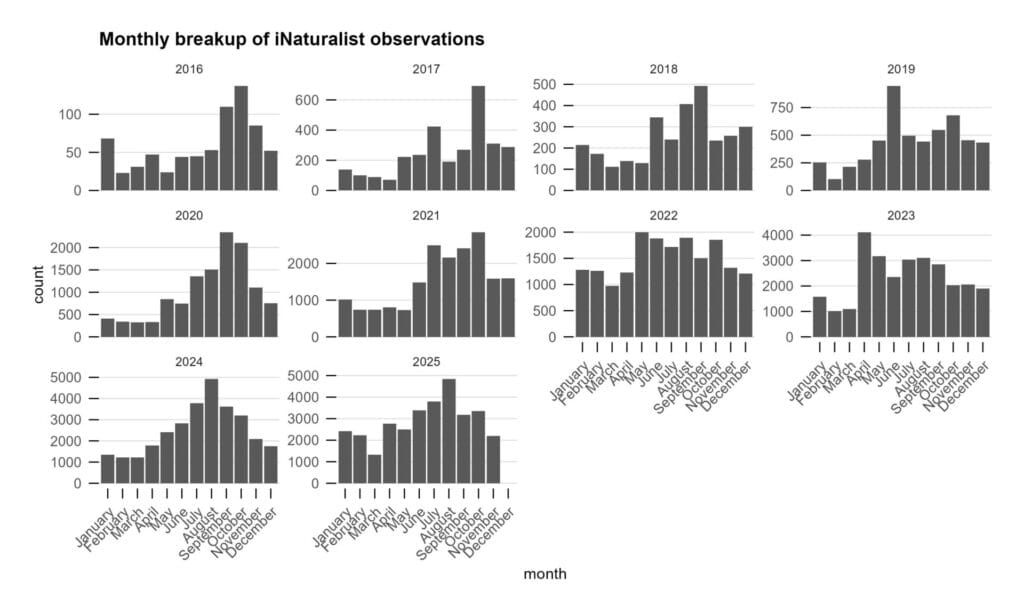
A month-wise analysis of the number of observations had mixed trends. The most consistent pattern that emerged was a generally low level of reporting in the first quarter of the year (January – March) which steadily increases during monsoon and post-monsoon months (May-October) (Figure 2).
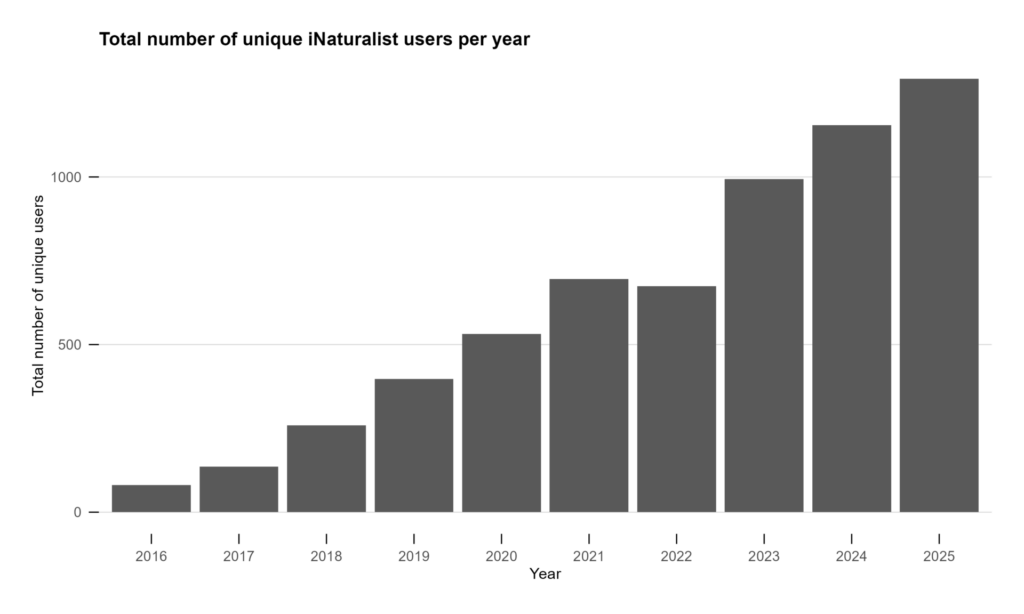
The increase in number of observations is accompanied with growth in unique numbers of observers, which grew from 81 to 1,293 in the same time period (Figure 3).
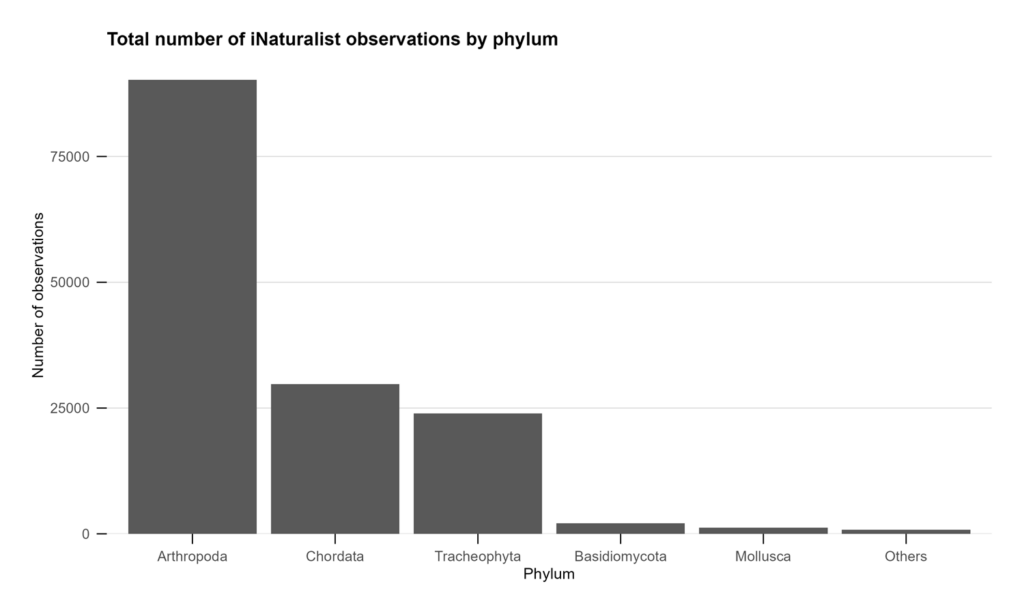
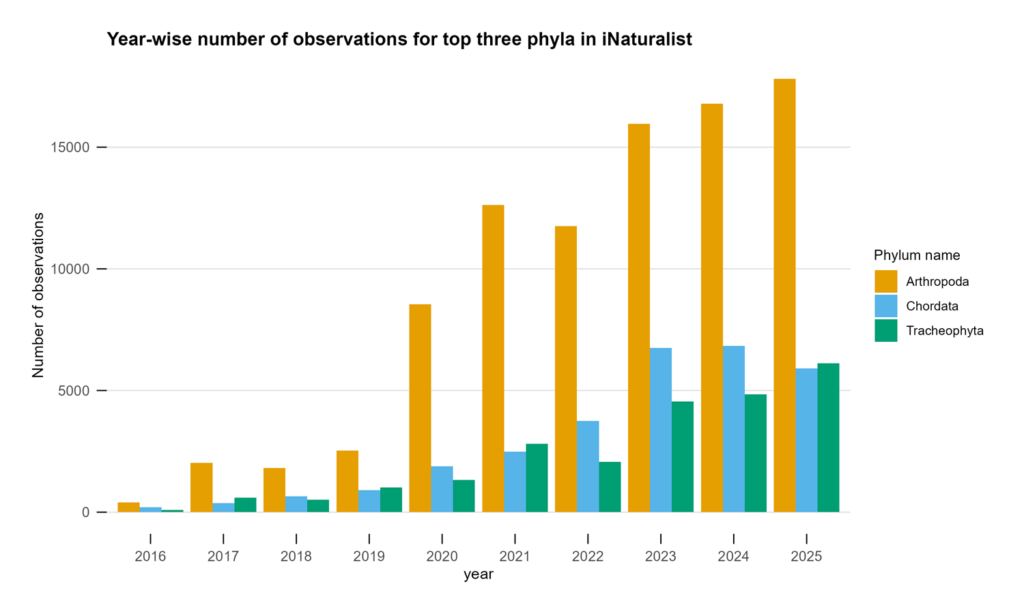
We observed marked variations in the number of observations across taxa. Out of more than 148,000 wildlife observations recorded in Bengaluru (using phylum as a unit for this analysis), the vast majority came from Arthropoda — invertebrates including insects, spiders, crabs, shrimp, millipedes and centipedes comprised about 61% of all records.
Vertebrates (Chordata) followed with 20%, and vascular plants (Tracheophyta) contributed 16%.
Among vertebrates, birds dominated absolutely—82% of all vertebrate sightings were feathered friends, with reptiles (11%) and mammals (4%) trailing far behind. Amphibians showed up modestly, while fish were rarely reported.
This overwhelming focus on birds isn’t just chance. It reflects both the rich birdlife of urban Bengaluru and the strong birdwatching culture among citizen scientists.
Read more: Pelicans once common in Bengaluru lakes are vanishing
A temporal analysis of the top three phyla, namely Arthropoda, Chordata, and Tracheophyta shows that while Arthropoda has always dominated the citizen science observations, the prominence of vertebrate animals over vascular plants starts growing from the year 2022 (Figure 5).
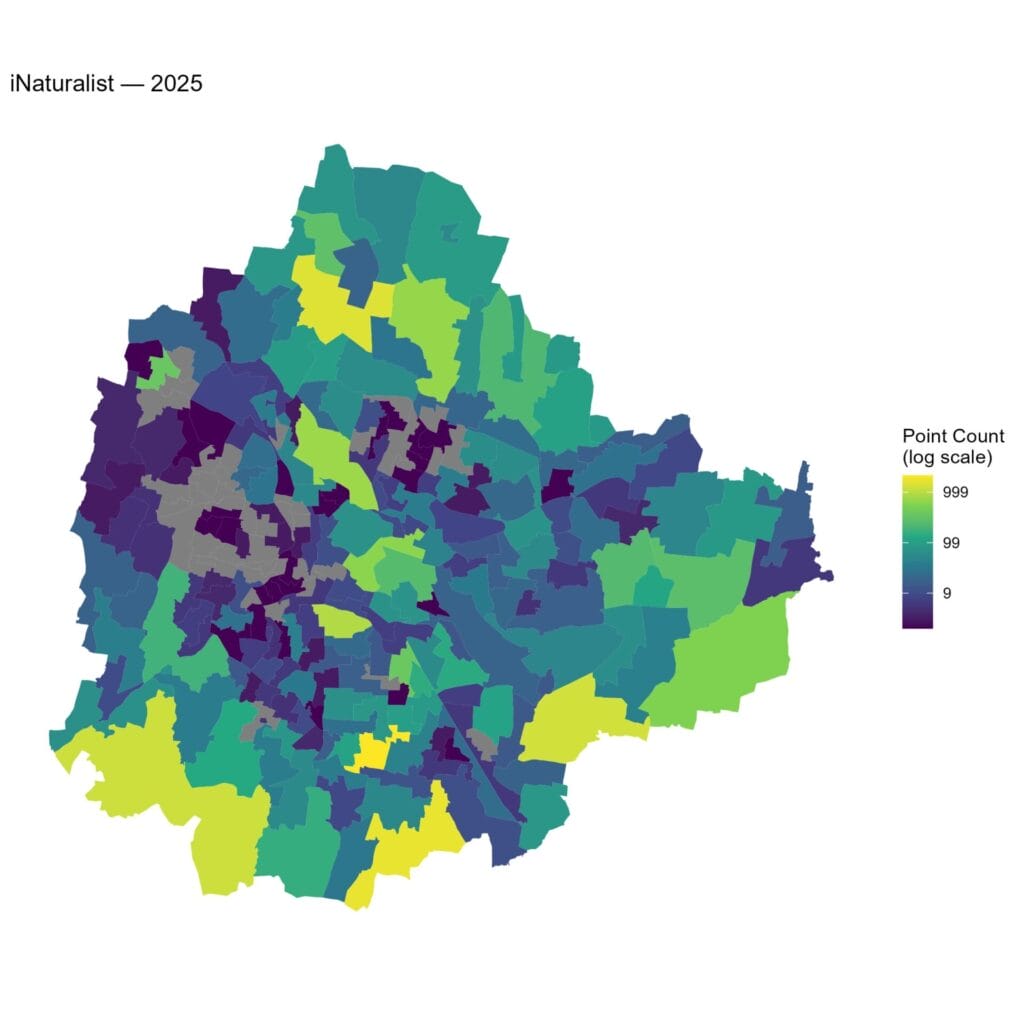
The volume of data recorded differs significantly from one area of the city to another; the data-rich areas are concentrated along the northern corridor and across the southern and southeastern edges of Bengaluru (Figure 6). In contrast, large contiguous areas in the central and west-central regions show significant data deficiency.
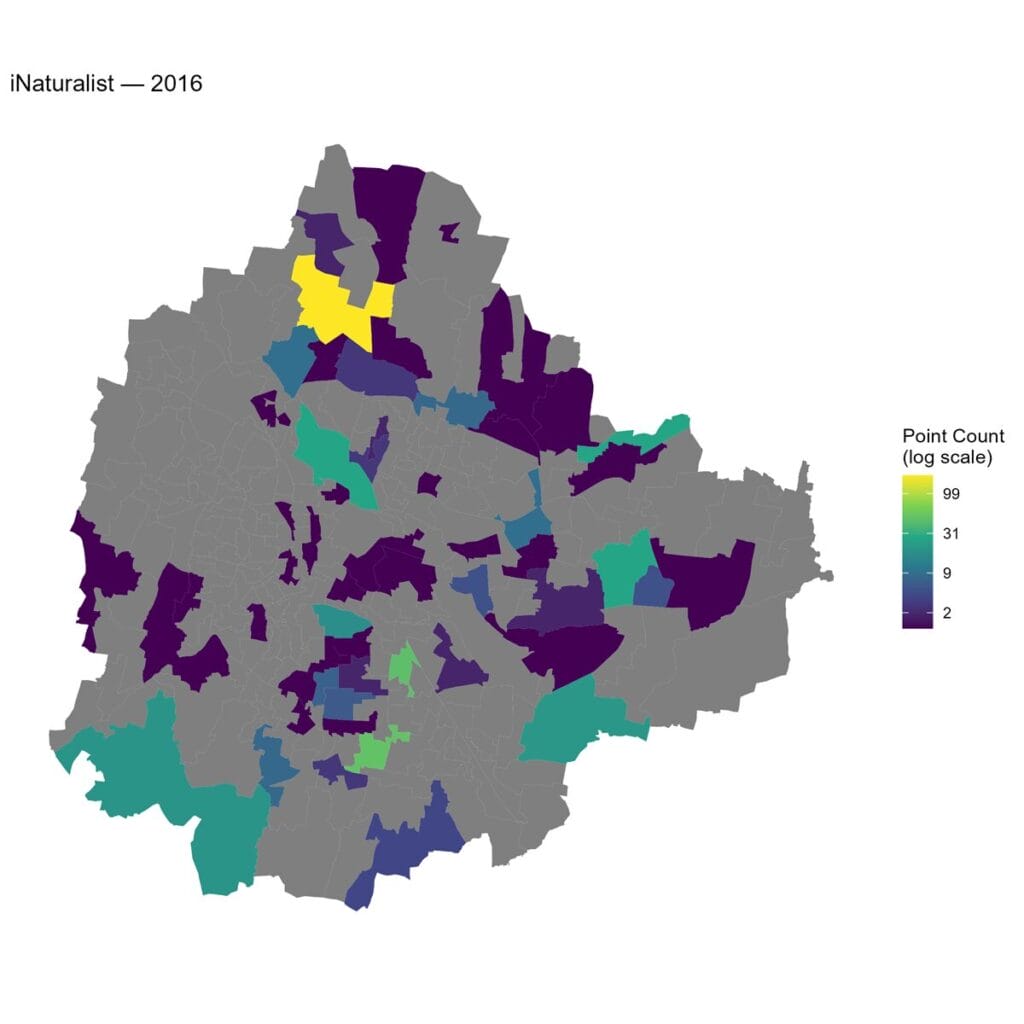
Wards such as Hemmigepura (13,104 observations), Byatarayanapura (7,744), and Doddakanahalli (7,069) recorded the highest iNaturalist observation counts, while several central wards recorded fewer than 100 observations over the entire study period. The presence of Gandhi Krishi Vignana Kendra (GKVK) campus and National Center for Biological Sciences (NCBS) in Byatarayanapura ward could possibly be the reason for the high number of observations here.
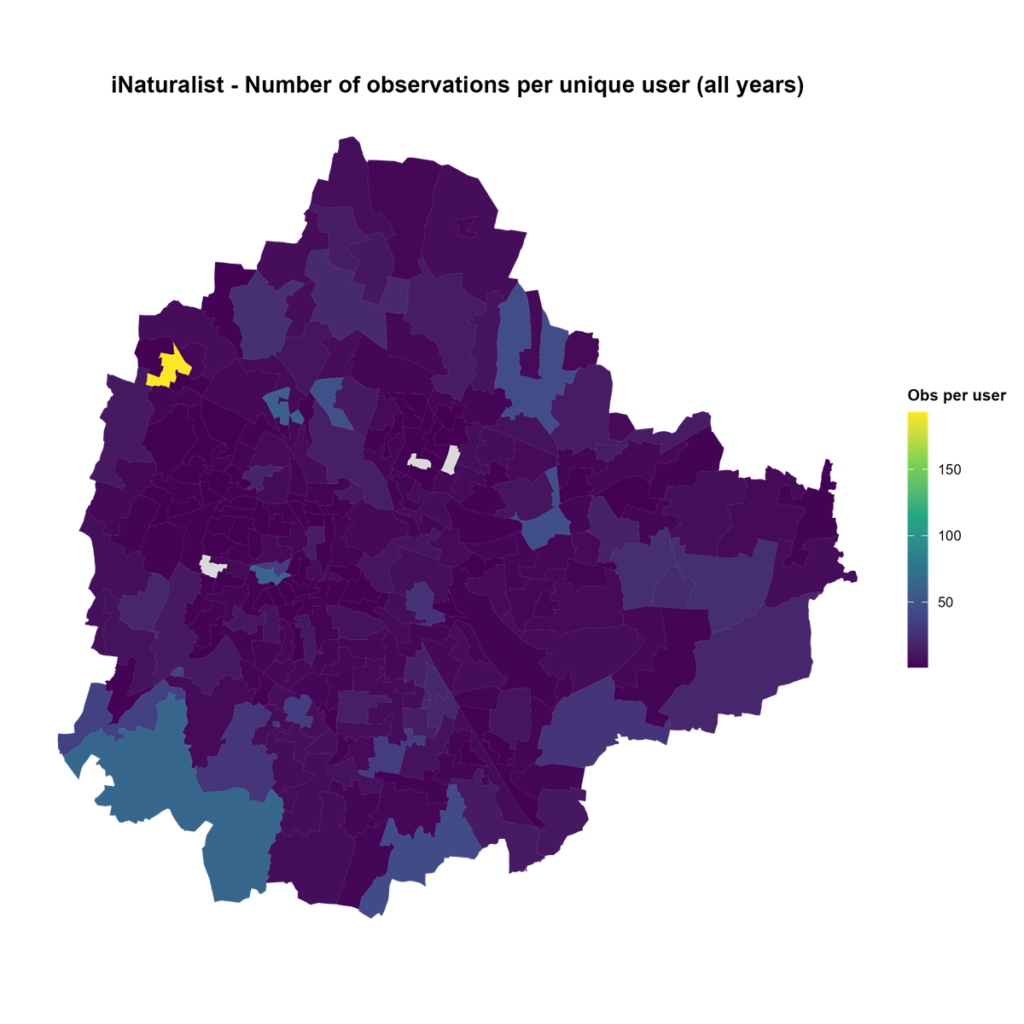
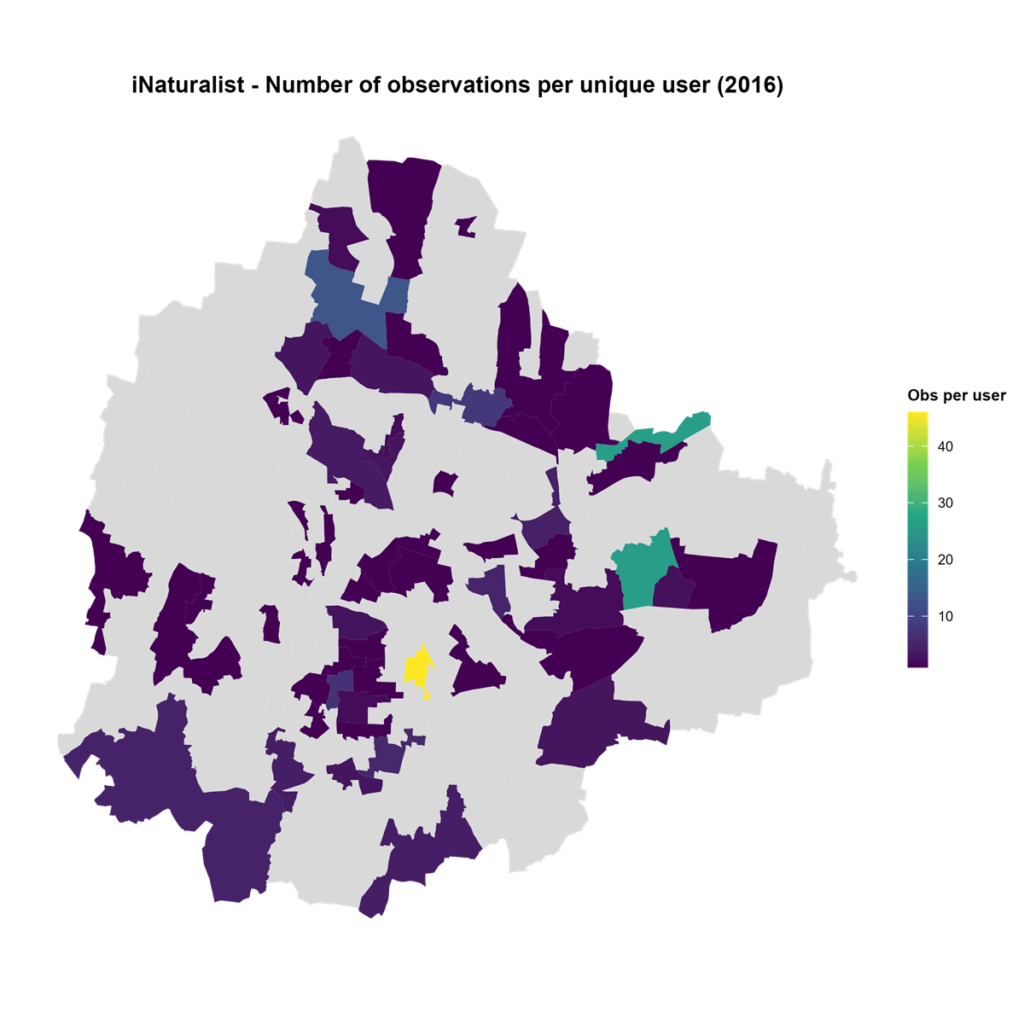
We also calculated the observer effort in terms of the number of observations per unique observer across wards. Wards with higher observer effort, notably Defence Colony (Ward number 19) (193 observations per user) and Hemmigepura (Ward number 35) (64.2), indicate the presence of highly active individual naturalists rather than broad community participation. Figure 7 shows the spatial patterns.
The spatial growth in observations between 2016 and 2025 is shown in Figures 8A and 8B. In 2016, only a few wards had observations, with large portions of the city showing no data. By 2025, coverage had expanded substantially across most wards, though the central and west-central areas remained comparatively data-deficient.
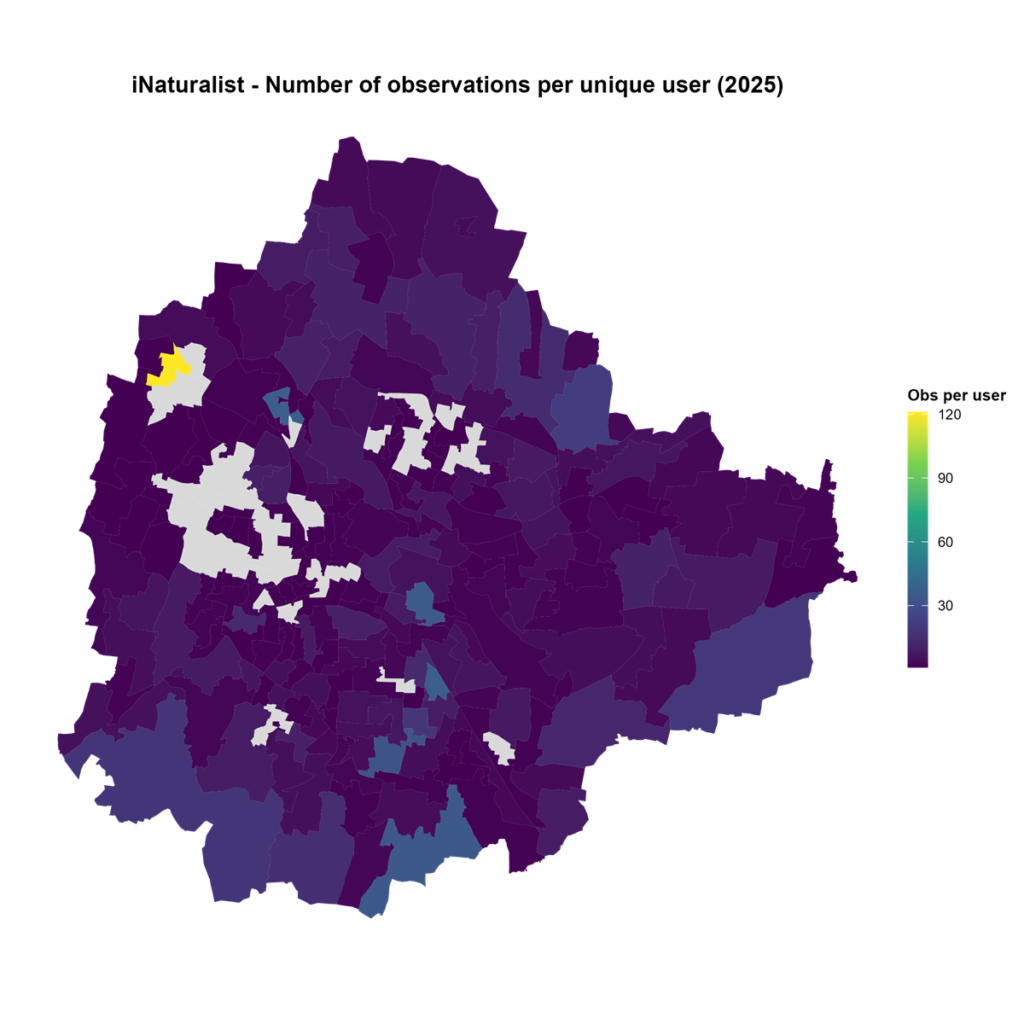
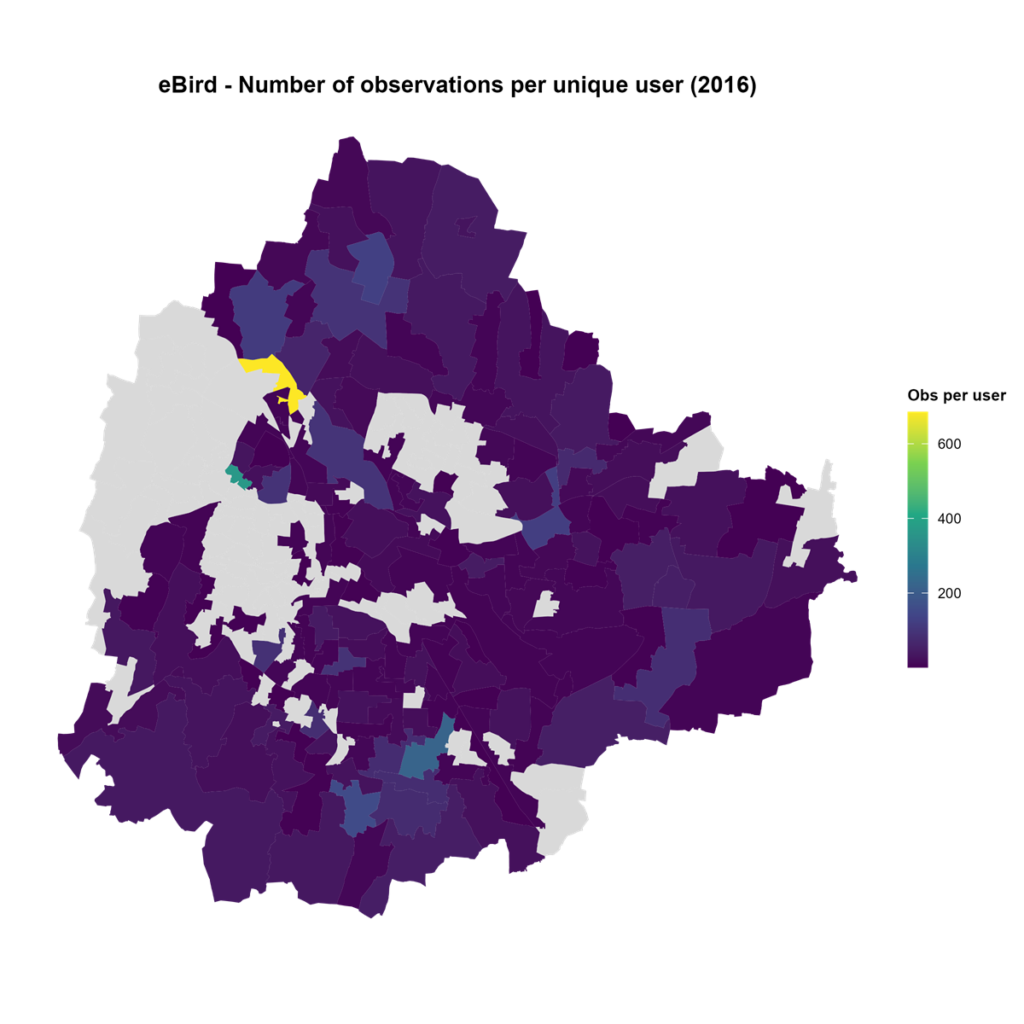
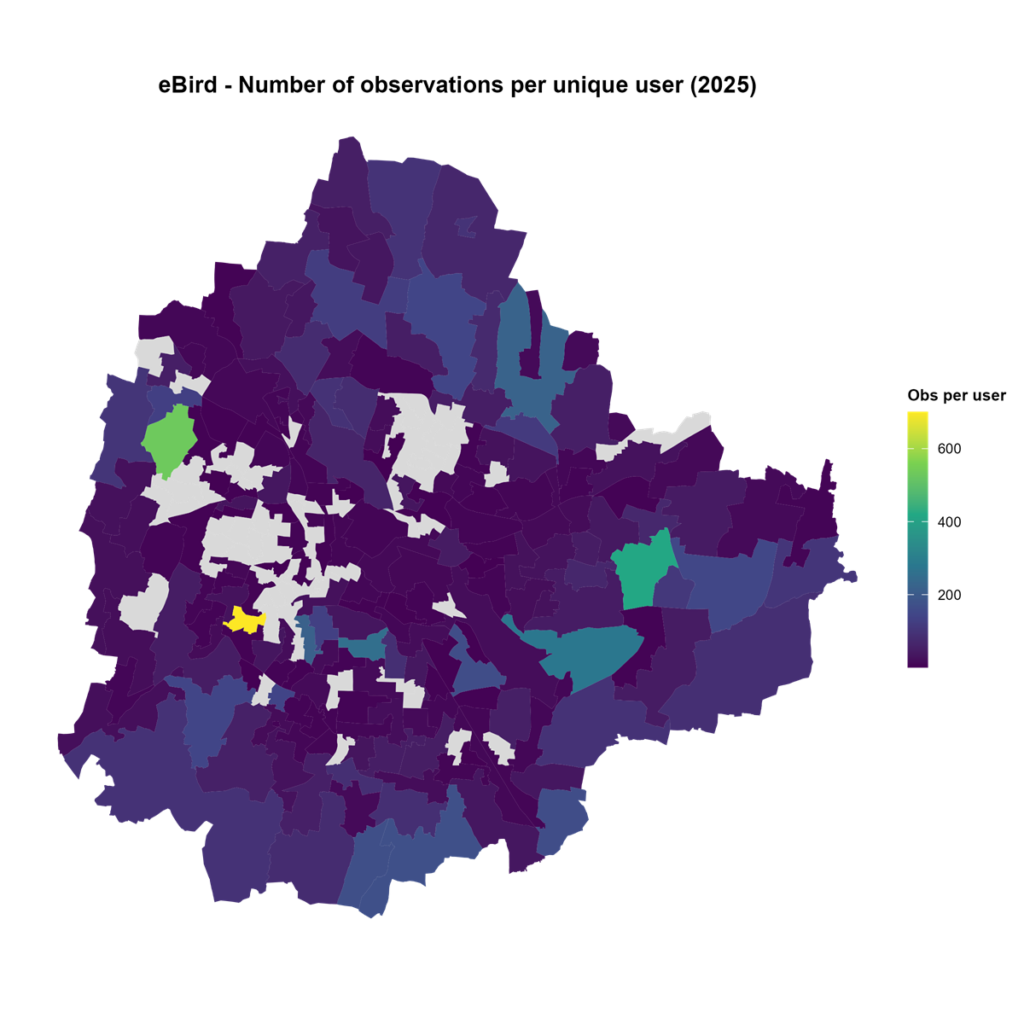
The change in observer effort between 2016 and 2025 is shown in Figure 9. While 2016 shows only a handful of wards with meaningful observations per user, by 2025 the pattern has shifted towards more widespread but still concentrated effort — with one northwest ward standing out sharply as an outlier with over 120 observations per user.
Patterns of eBird observations
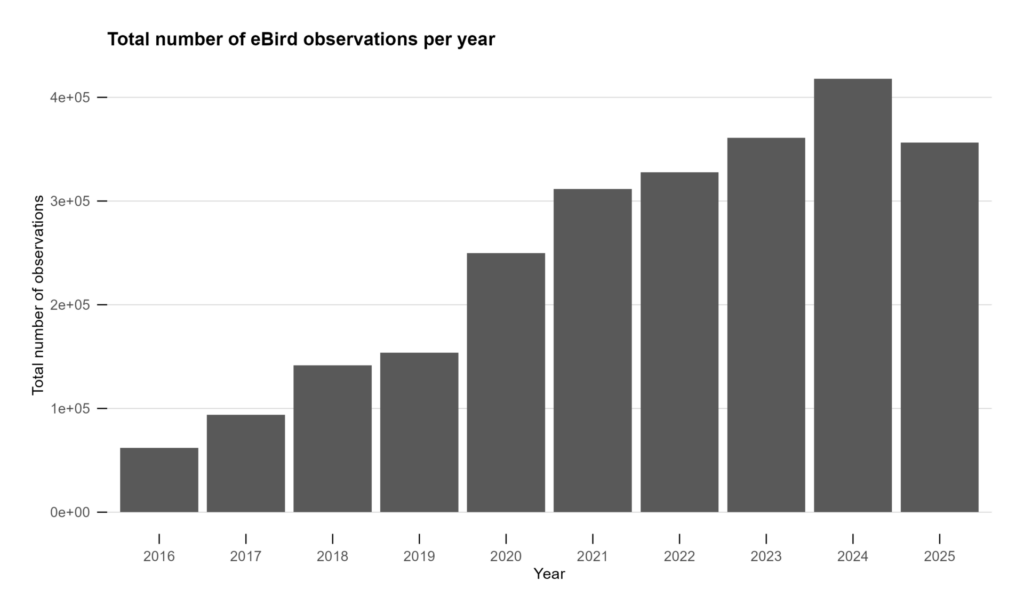
The number of observations on the eBird portal grew from 61,942 in 2016 to 356,445 in 2025.
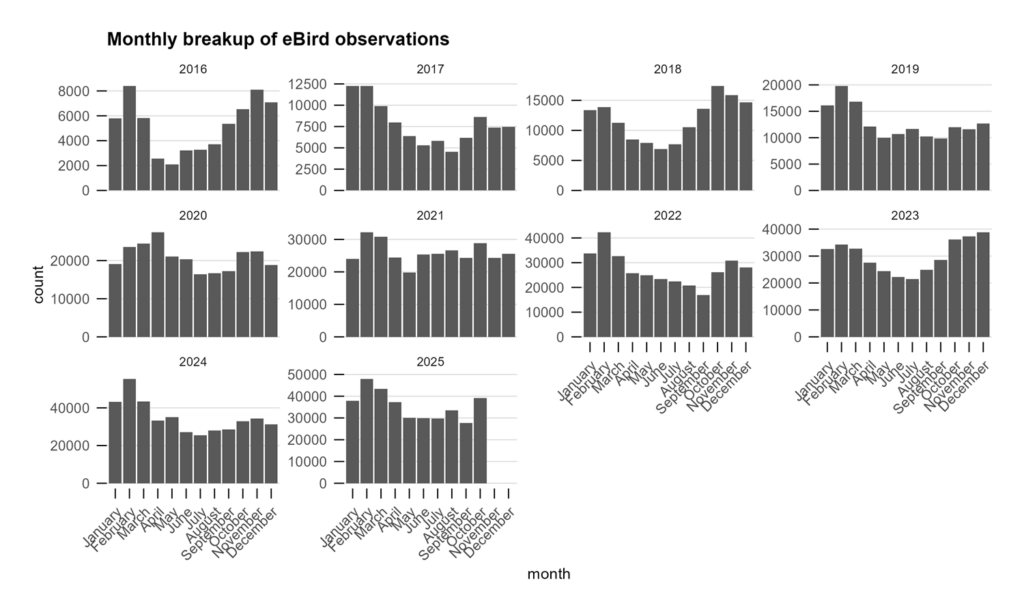
A monthly breakup of observations depicts peaks occurring in the months of January and February, with a secondary peak in November and December (Figure 11). This pattern is consistent across most years and likely reflects the winter migratory bird season, when species richness in Bangalore is highest. Also, cooler temperatures make early morning outdoor activity more appealing to birders.
The mid-year months of June–August tend to show the lowest counts, coinciding with the southwest monsoon. In contrast to iNaturalist observations, which peak during monsoon months when insects and other invertebrates are most active, eBird activity is driven primarily by the bird survey community whose peak effort follows the migratory calendar.
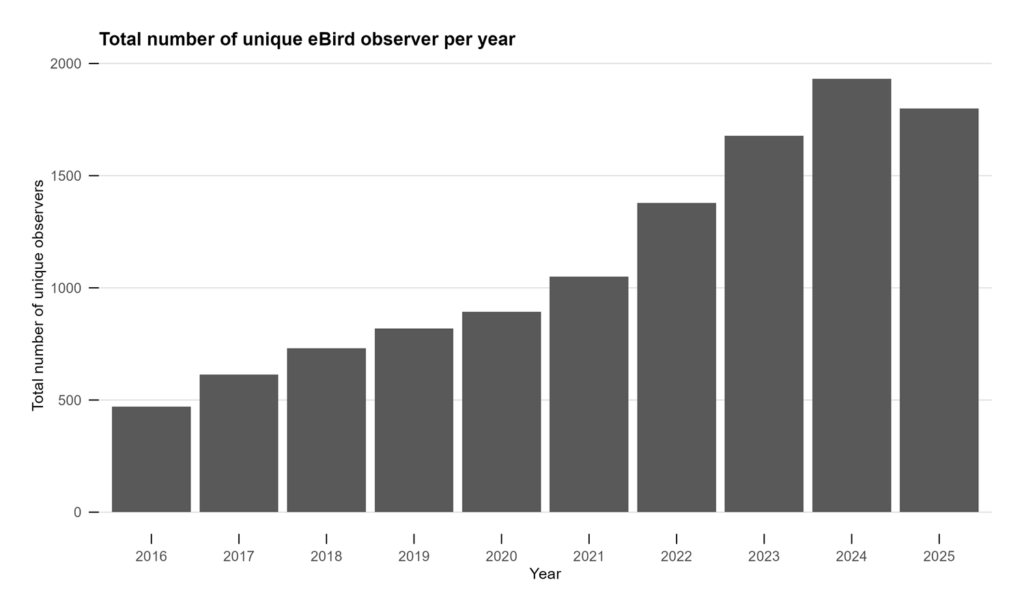
The total number of unique eBird observers also grew steadily, from 470 in 2016 to a peak of approximately 1,900 in 2024 before a slight decline in 2025 (Figure 12). However, it is important to note that the data for 2025 is only till October 2025 and does not include the data for the months of November and December.
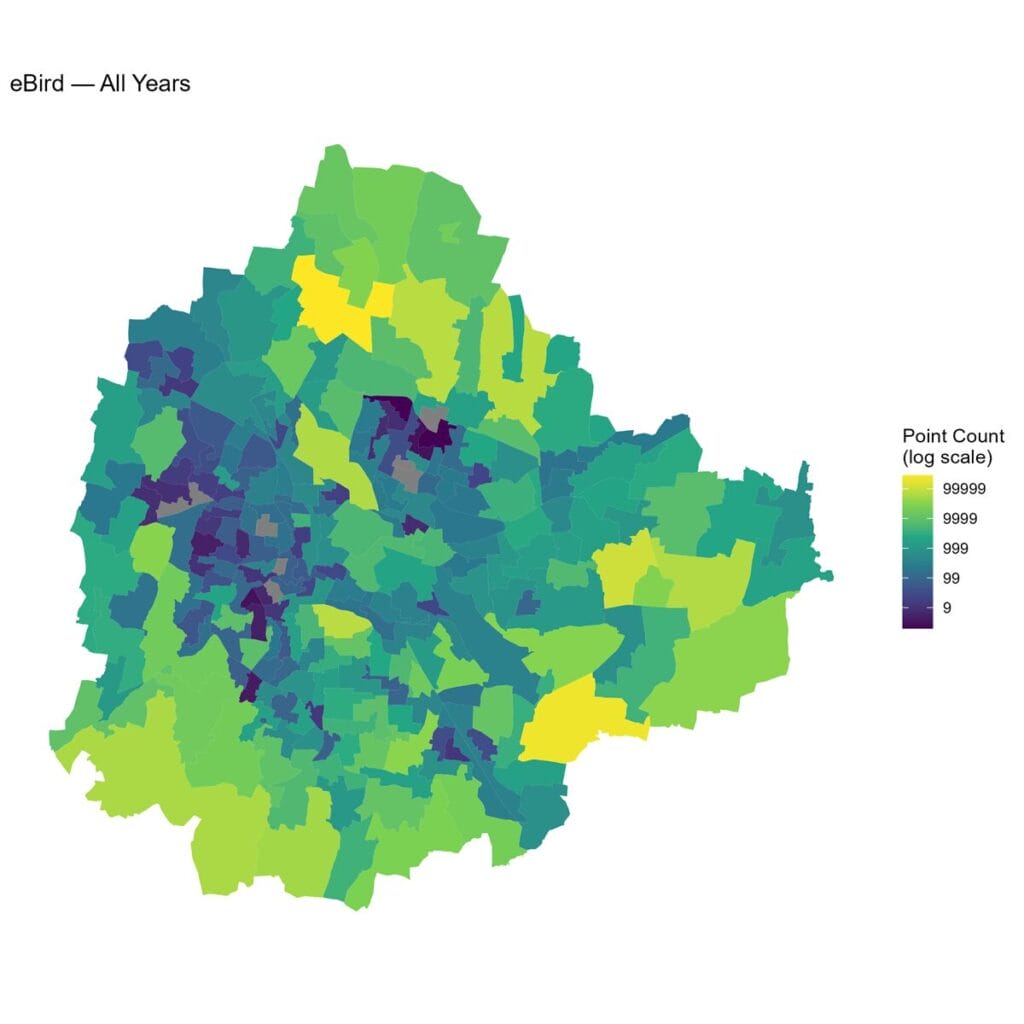
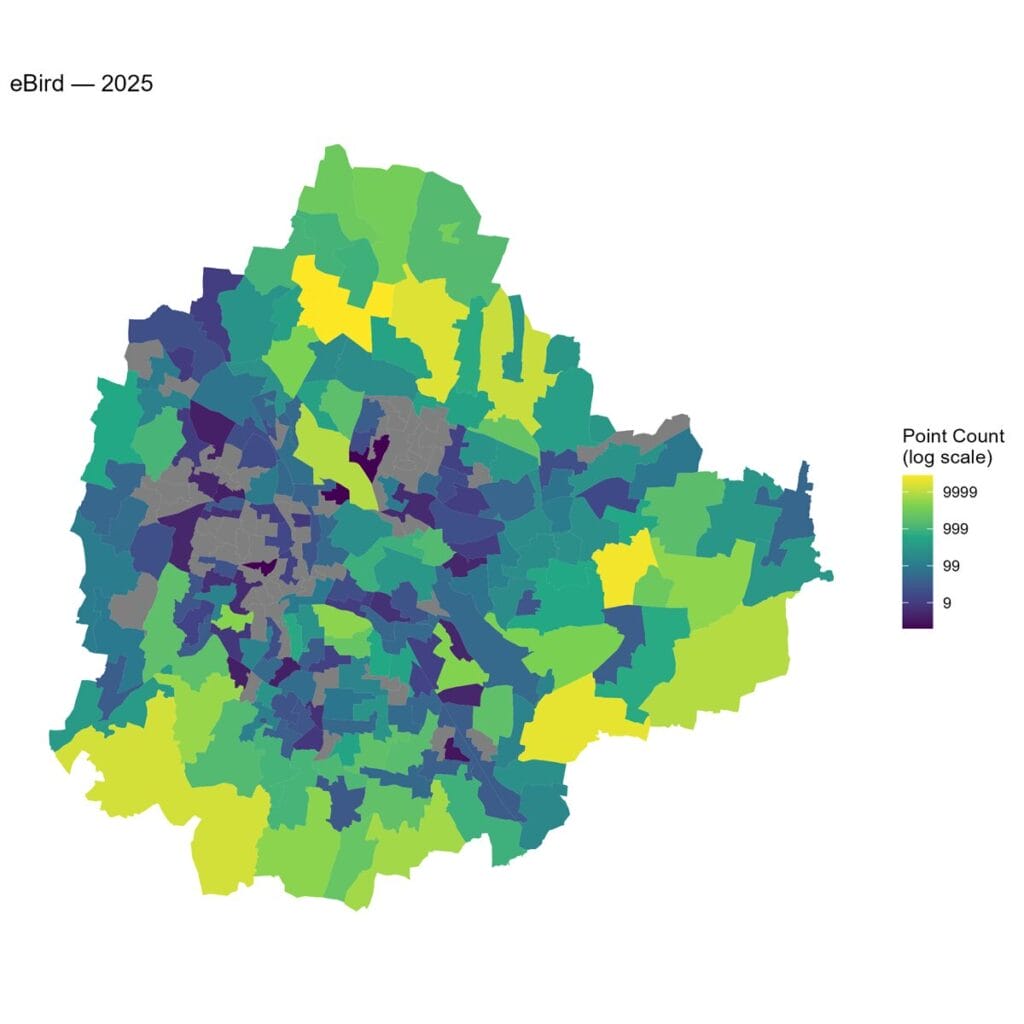
The total number of observations across wards differed markedly, with the highest numbers concentrated in northern, north-central, and eastern regions of Bangalore (Figure 13).
A prominent band of data deficiency runs through the central area, while the southern and western peripheries show moderate to high data density.
The top eBird wards by total observations were Byatarayanapura (2,80,522 observations, 842 observers), Doddakanahalli (2,10,834 observations, 912 observers), and Dodda Nekkundi (1,11,361 observations, 303 observers) — all located in the northern or southeastern periphery of the city. These wards likely benefit from proximity to lakes, open fields, and green corridors that attract both birds and birders.

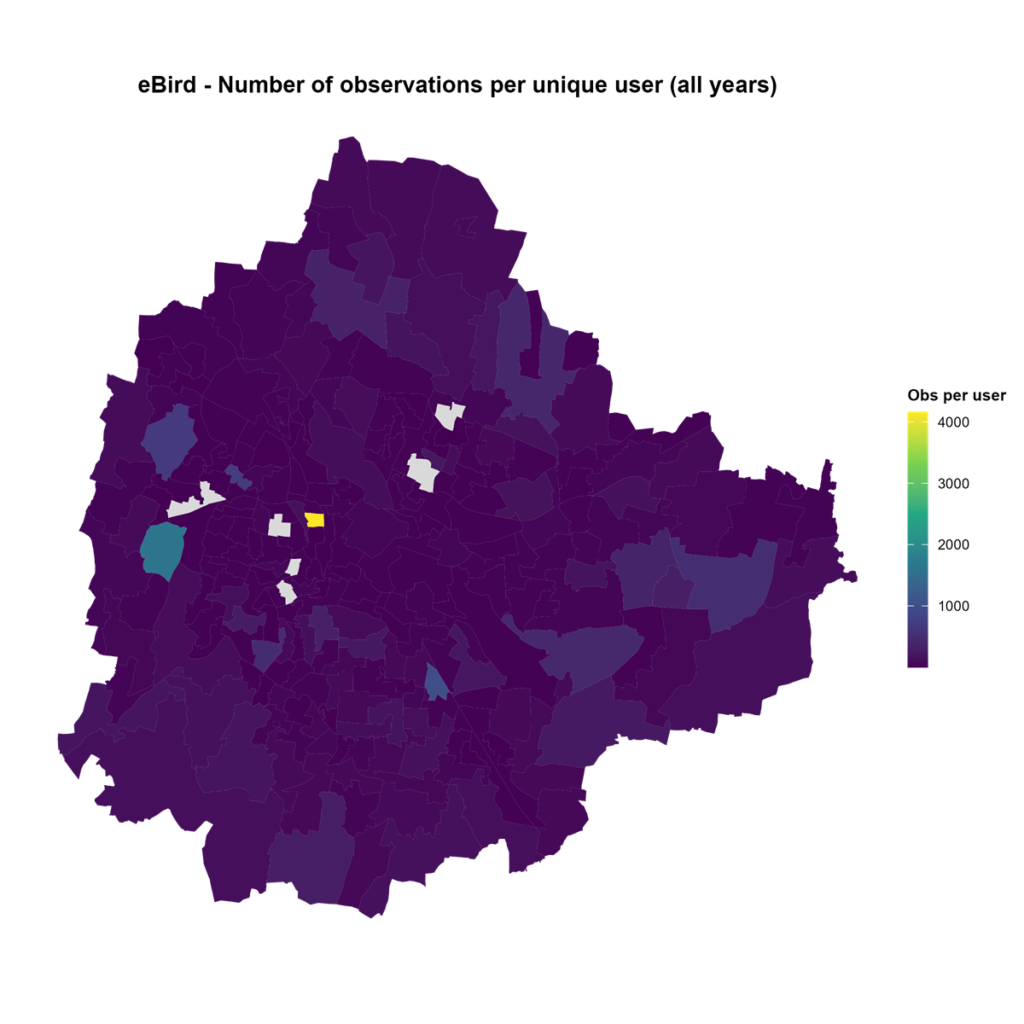
Observer effort (observations per unique user) in eBird reveals that a small number of wards have disproportionately high effort, with Dayananda Nagar recording 4,159 observations per user, and Sir M. Vishweshwaraiah ward at 1,592 (Figure 14). These extreme values suggest the presence of a dedicated single observer or small group making the bulk of submissions from those locations, rather than broad community uptake.
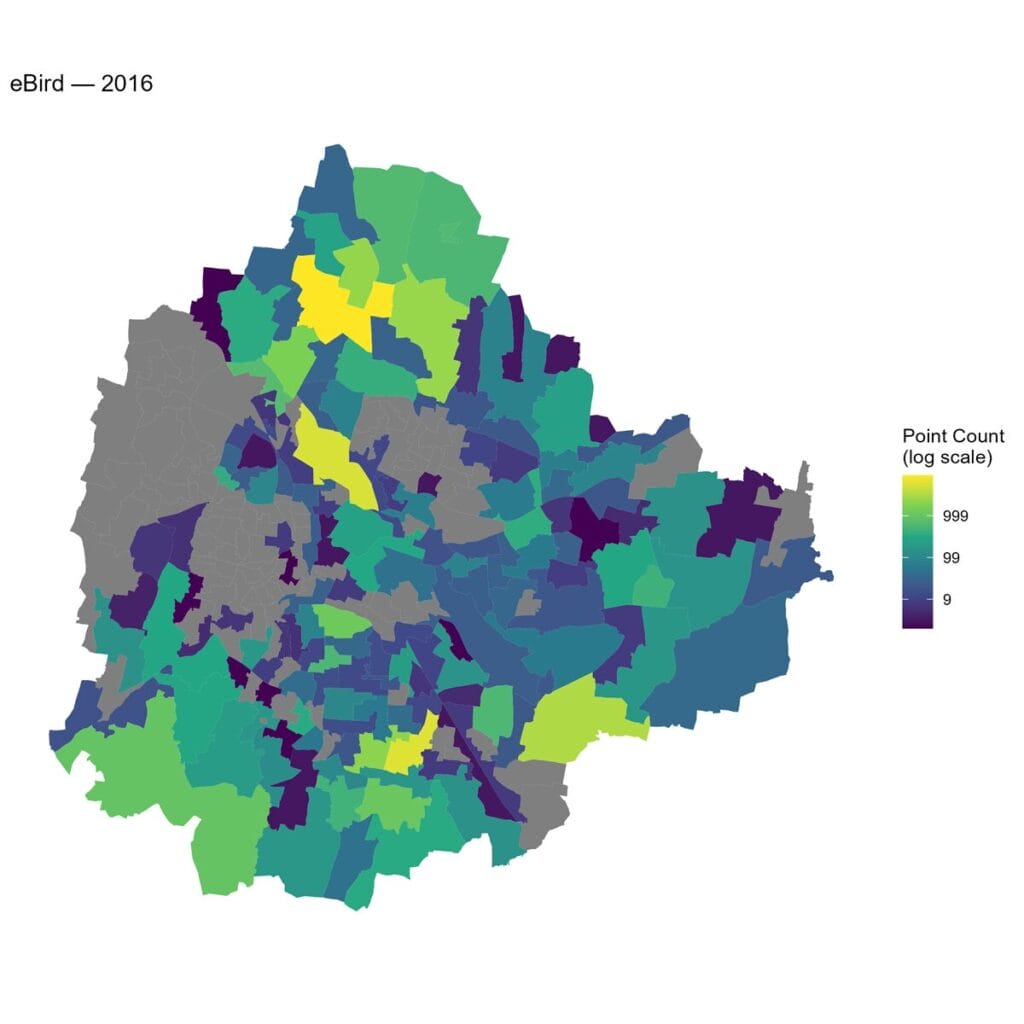
The spatial comparison between 2016 and 2025 shows that eBird coverage was already relatively broad in 2016 compared to iNaturalist, reflecting the earlier establishment of Bangalore’s birdwatching community (Figures 15 and Figure 16).
The way forward
This research highlights critical gaps in urban biodiversity data and demonstrates that citizen science participation is determined by where they live and how they spend time. . In Bengaluru, some central and west-central neighbourhoods have very little data, making them clear priorities for outreach. Hosting bioblitz events, working with schools and local resident groups here, and nurturing naturalist communities could help bring more data from these areas into the picture..
The strong seasonal and taxonomic (species-based) biases observed in the data also underscore the value of platform diversity: eBird and iNaturalist together offer a more complete picture of urban biodiversity than either platform alone.
Also read:
- Be a Citizen Scientist: Contribute to ‘Decoding Everyday’
- If you want to map birdlife around you, MYNA will help
- Why all Bengaluru lakes need a biodiversity survey: Lessons from Dorekere