Mumbai’s L Ward, covering Kurla, Chandivali, Saki Naka, and Powai, has been quietly heating up, and not just metaphorically. It is a ward of extremes: dense slums on one side, luxury high-rises and malls on the other. But when the mercury rises, the contrasts fade, and everyone feels the burn. With urban heat on the rise across the city, L Ward is emerging as one of Mumbai’s hotspots where everyday life is increasingly being shaped by climate stress.
The heat problem
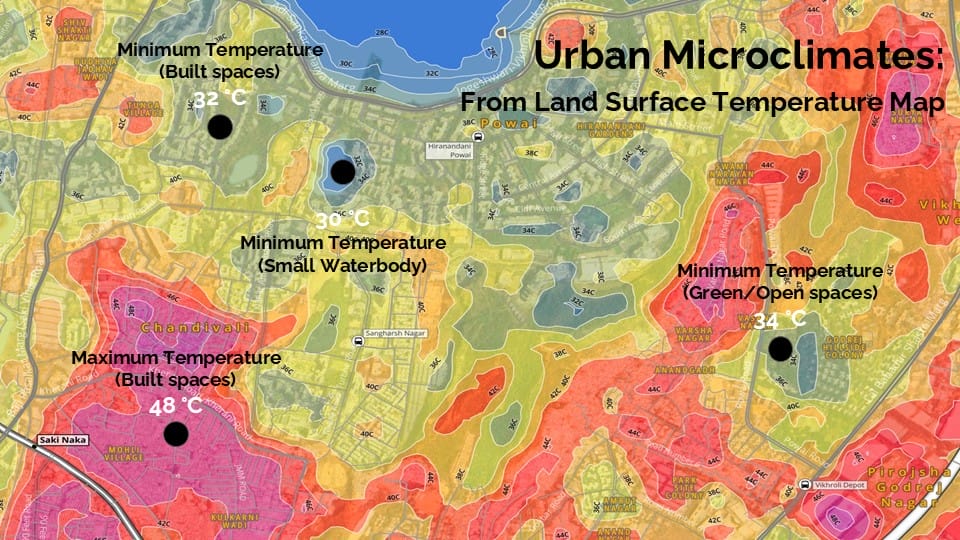
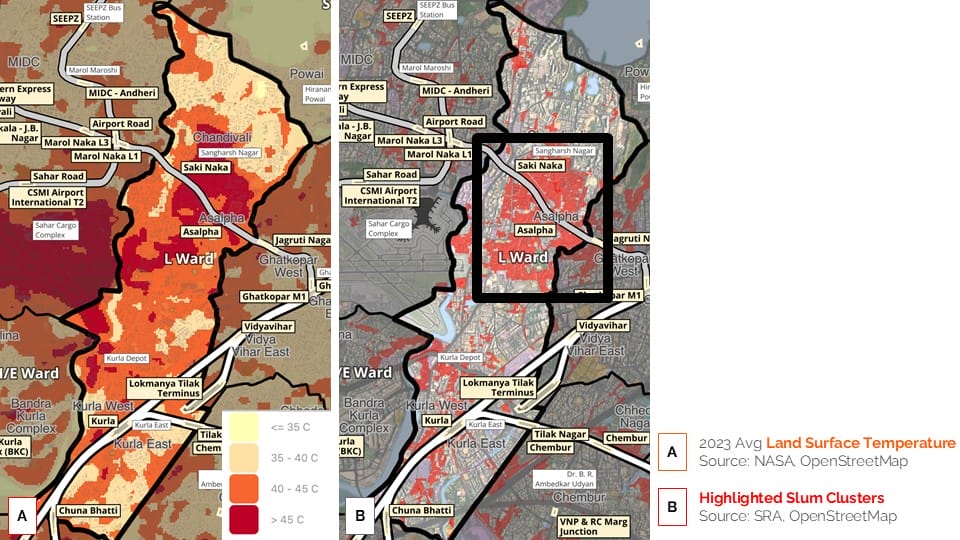
Spread across 15.6 sq km, L Ward is home to more than nine lakh people, packed into one of Mumbai’s most crowded landscapes. Almost a quarter of its land, 3.91 sq km, is a slum area, with Chandivali and the Asalpha–Saki Naka clusters being the largest. They are also the hottest parts of the ward with surface temperatures soaring to a brutal 48 °C on hot days.
The reasons aren’t hard to see:
- Roofs made of tin, asbestos, and corrugated sheets soak up heat.
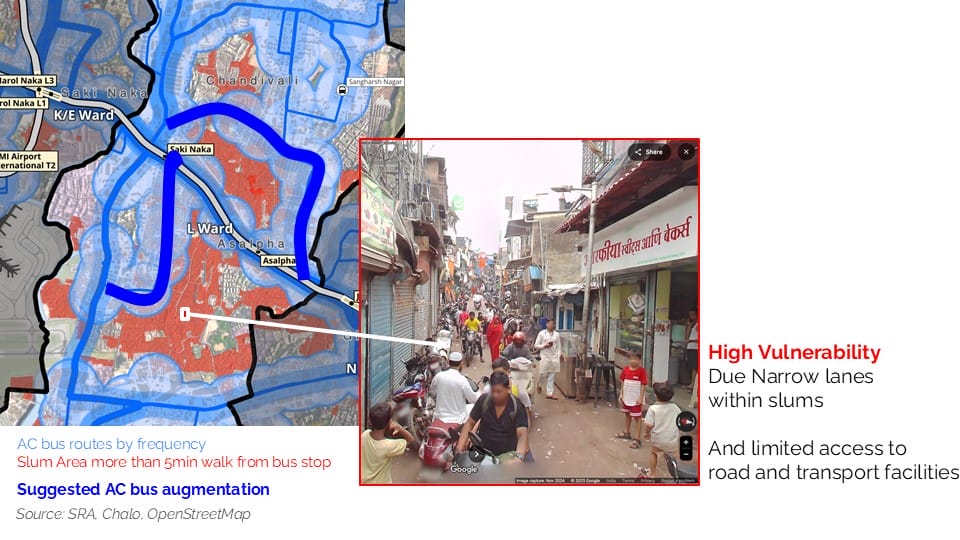
- Narrow lanes choke off ventilation.
- Open spaces are rare, trees rarer.
- Stagnant blackwater and polluted stretches of the Mithi River add to the discomfort.
Compare that with the ward’s greener patches. Minimum temperatures in small waterbodies hover around 30°C, and in green or open spaces, they stay around 34°C. That’s almost a 15-degree difference from the heat trapped in built-up neighbourhoods.
As part of the Urban Heat datajam organised by OpenCity, we analysed land surface temperatures in L Ward and examined how accessible transport is in the ward. We found that apart from one trunk route, there are no major routes where AC buses are plying in the area, leaving people commuting by public transport vulnerable to the extreme heat.
Where the heat hurts most
Walk through Chandivali’s lanes, and you will understand why this part of Mumbai feels like a furnace. Homes are built so close together that no breeze can get in. Tin roofs absorb the day’s sun and radiate it back well into the night. For the 57,835 people packed into every square kilometre of this ward, every extra degree matters.
The most vulnerable are:
- Slum residents, especially children and the elderly, whose homes turn into ovens after sunset.
- Outdoor workers such as construction labourers, bus drivers, and street vendors who face prolonged exposure.
- Public transport users, thousands of whom wait daily at bus stops without shade or walk along sun-baked roads.
Heat has even reshaped infrastructure. The Andheri–Ghatkopar Link Road has warmed by nearly 5°C in the last decade, thanks to rising traffic, metro activity near Saki Naka and Asalpha, and unrelenting concrete.
Read more: Rising temperatures, shrinking green cover: Urban heat crisis in Mumbai’s P/North Ward
Why this matters beyond Mumbai
L Ward isn’t unique. It’s a preview of what Indian cities could look like as global temperatures rise. The urban poor heat up faster, suffer longer, and have fewer ways to escape. Natural buffers like the Mithi River and Powai Lake, once cooling assets, are choked with pollution and surrounded by construction. The choice to prioritise development over livability has left residents paying with their health.
Solutions that could actually work
The fixes are not rocket science, but they need political will and community involvement. The ward plan lays out a few that can make a real difference:
- Cool the streets: Replace black asphalt with heat-reflecting materials. Use cool roofs such as simple white coatings or solar-reflective paints that can drop indoor temperatures by up to 5°C.
- Heat-resistant infrastructure: Implement heat-resistant pavements, rail tracks, and vehicles to mitigate the impact on transport infrastructure.
- Bring back green: Plant native trees in hotspots like Chandivali and Swami Narayan Nagar. Open up paved courtyards in housing societies. Encourage rooftop gardens and vertical greening.
- Fix public spaces: Install shade structures and drinking water stations at transit hubs. Make sure every bus stop has a roof and shaded seating.
- Protect workers: Introduce heat-wave warnings, mandate rest breaks, and set up cooling centres in vulnerable neighbourhoods.
- Revive water bodies: Clean and conserve Powai Lake and the Mithi River. Develop them as community cooling zones with trees, walkways, and minimal construction on their banks.
These aren’t abstract ideas. Cities such as Ahmedabad, with its Cool Roofs programme and Seoul with the Cheonggyecheon stream revival, have already shown how targeted interventions can cool urban heat islands.
The clock is ticking
This isn’t just about comfort. In a ward where people live and work outdoors, where homes are built without ventilation, and where infrastructure was never designed for 48°C summers, extreme heat has become a matter of survival.
L Ward could be Mumbai’s testing ground, a place where the city learns how to keep people safe in an era of extreme heat. But the window to act is closing quickly, as fast as the temperature is rising.