Bengaluru is often described as having “better air” than North Indian cities, yet new evidence shows this perception may be misleading. Data from 40 low‑cost air quality sensors set up by the Center for Study of Science, Technology and Policy (CSTEP) reveal sharp variations in pollution across time and place, patterns that citywide averages completely miss.
In this interview, Abhishek Penchala, Senior Analyst in CSTEP’s Air Quality team, tells Citizen Matters how hyperlocal monitoring uncovers hidden pollution hotspots, from waste burning to construction dust and traffic, that the sparse official network fails to detect, forcing us to rethink how urban air quality is measured and managed.
Excerpts from the interview:
The sensor network and its findings
Q: Which are some of the locations in Bengaluru, where the low-cost air quality sensors are located, and how were these places chosen for monitoring air quality?
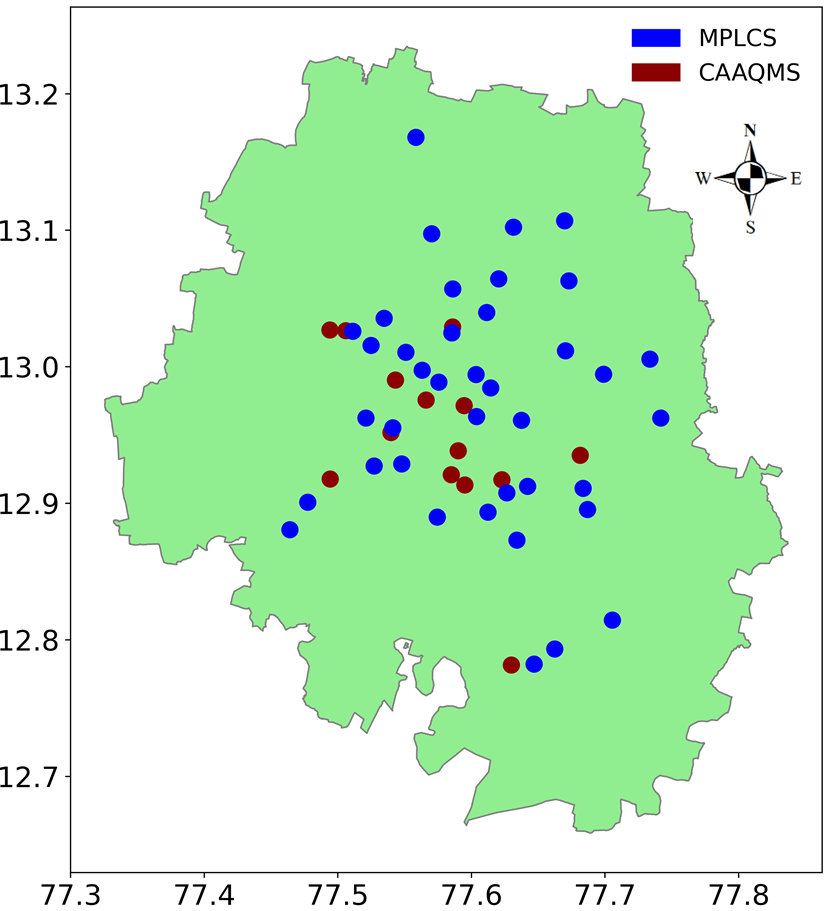
A: Bengaluru currently has 14 Continuous Ambient Air Quality Monitoring Stations (CAAQMS) that track air quality across the city. To complement this coverage, CSTEP has set up 40 multi‑pollutant low-cost sensors (MPLCS). The city was first divided into a 1 km by 1 km grid to decide where to place these sensors. Then, using satellite sensor data, we ranked pollution levels into 10 percentiles, helping identify the most suitable locations.
Based on these pollution levels and Central Pollution Control Board (CPCB)-recommended land-use patterns (residential, built-up, commercial, kerbside, and industrial), the final representative sites were selected (Figure 1). Some of the locations include Whitefield, Yeshwanthpur, Tranquil City, Kannali, Mitaganahalli, Mahalaxmi Layout, Rajankunte, Bommanahalli, and Srirampura.
Q: Can you give a brief overview of the 40 low-cost sensors installed in Bengaluru, and explain how they help monitor air quality?
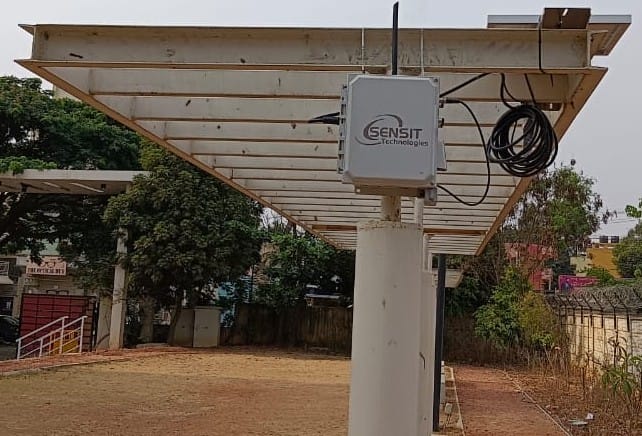
A: The current low-cost sensor network in Bengaluru is intended to complement the sparse network of the Continuous Ambient Air Quality Monitoring System (CAAQMS). The sensor network is capable of continuously measuring concentrations of multiple pollutants (PM10, PM2.5, Carbon monoxide, Nitrogen dioxide, and Ozone) in real time, with detailed data across different places and times. These sensors help understand the variations in air quality across the city and identify hotspot locations. Owing to their compact and portable features, they can also be located close to sources in dynamic environments.
Detecting pollution from local activities
Q: What are some findings or observations from the 40 low-cost sensors that are installed in Bengaluru, that stresses the importance of hyperlocal monitoring?
A: Analysis of sensor network data in Bengaluru has revealed large spatial and day-to-day variability in pollution concentrations across various locations because of the impact of local activities like garbage burning. Further, among residential, commercial, kerbside, and other built-up environments, industrial areas were found to be the primary hotspot, with PM2.5 concentrations above 40 μg m-3 during most hours of the day.
Similarly, the West and South zones recorded higher PM2.5, PM10, and CO concentrations. These observations stress the importance of hyperlocal monitoring in identifying micro-scale pollution hotspots and detecting exposure differences that are otherwise masked in city-averaged air quality assessments.
Read more: PM2.5 pollution: Why Bengaluru urgently needs hyperlocal air quality monitoring
What hyperlocal monitoring reveals
Q: What were the typical trends observed that were common across locations?
We found significant differences in pollution concentrations from place to place, even over short distances, driven by local activities. Most sensor devices reported elevated pollution levels during the morning and evening rush hours, likely influenced by traffic emissions. We also observed large seasonal variability across the city, with winter recording the highest pollution levels and monsoon the lowest (winter > summer > post-monsoon > monsoon) (Figure 2). These observations were similar to those reported in the CAAQMS data.
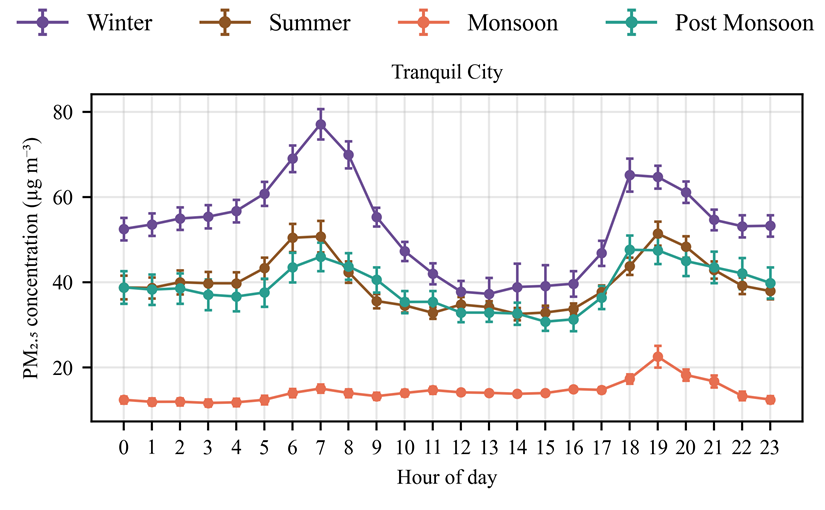
However, a few residential and kerbside locations close to the ongoing metro-rail construction have registered higher levels of PM10.
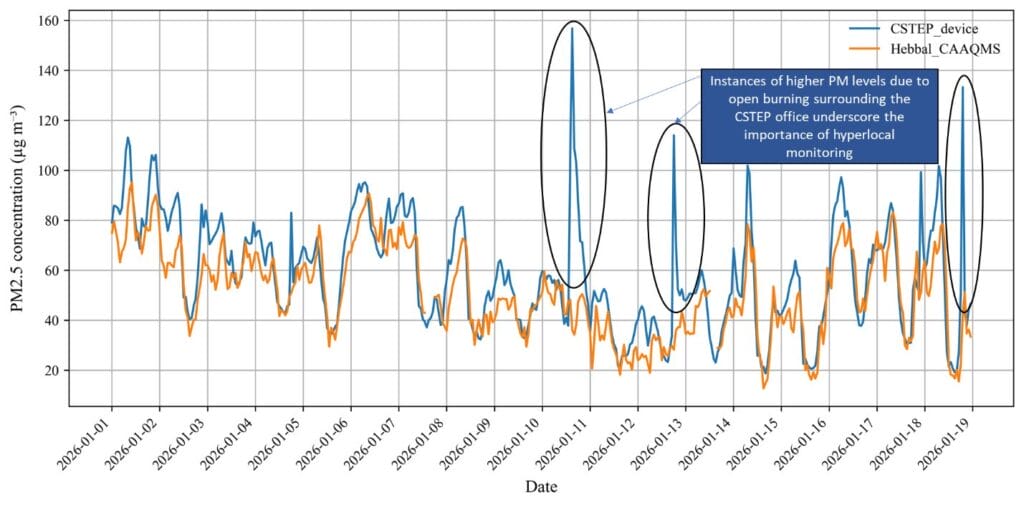
Q: Have you noticed any major spikes or other observations that give a different picture about the air quality in Bengaluru, when compared to the CAAQMS data?
A: The monitoring devices deployed at the CSTEP office consistently report higher PM2.5 levels with frequent fluctuations owing to emissions from nearby sources, such as open burning of dry waste. However, the Hebbal CAAQMS monitor located within a distance of ~3 km is unable to capture this impact because of the distance from such localised emissions. These observations show that pollution levels can vary greatly even within short distances, highlighting why dense urban areas need hyperlocal monitoring.
Monitoring gaps
Q: While AQI in Bengaluru is considered ‘satisfactory’ by NAAQ Standards, PM2.5 levels are mostly five tosix times higher than WHO standards. What are your thoughts on this?
A: India’s baseline level of PM concentration without local sources like traffic or industries is 18–70 µg m-3, which is several times the WHO-recommended guideline. Consequently, the pollution concentrations reported across different parts of India are several times higher than the WHO guidelines. Therefore, achieving WHO guideline levels in the short term is structurally challenging.
Also, directly comparing national air quality with that of developed and technologically advanced nations may not yield actionable insights at the ground level. A realistic and pragmatic approach would be to prioritise consistent compliance with the current NAAQS, with an immediate goal to ensure that 70%–80% of the population is exposed to better air quality for a complete year. The WHO guideline can be considered as our long-term target.
Do cities in South India really have clean air?
Q: Beyond AQI numbers and comparisons with North Indian cities, what factors contribute to the perception that South Indian cities have cleaner air? How do monitoring gaps, exposure patterns, and communication failures shape this understanding?
A: Relatively speaking, South Indian cities have lower pollutant concentrations than cities in the Indo-Gangetic Plain, although they may still exceed the Indian NAAQS particularly during the winter season. Further, limited and spatially sparse air quality monitoring in South Indian cities may miss the actual impact of several emission sources, giving the impression that air quality is good. This is where hyperlocal monitoring, as currently implemented in Bengaluru, could prove to be valuable.
There is also a need for increased awareness of air quality conditions among citizens and stronger public communication and media outreach on air quality in parts of South India.
Read more: Mumbai air pollution: Airshed level governance critical for clean air
How can citizens contribute
Q: How can citizens have access to this data and how can they use it? How can they use this information to hold local governments responsible for activities like open waste burning?
A: Citizens can access air quality data from the CAAQMS stations in real time through the CPCB’s data portal. Data from the sensor network operated by CSTEP are currently not available online. Discussions with other ecosystem participants are underway to enable broader access. These data are useful to understand hyperlocal patterns and pollution hotspots and can help build awareness. Although the sensor data cannot be used for regulatory purposes, they offer value for certain applications. For example, certain city governments, such as Mumbai, Delhi and Chennai, require the use of sensors at construction sites for real-time monitoring of PM10 and PM2.5. Such initiatives help move towards quick identification and mitigation of emissions.
Similarly, a common source of overlooked emissions at residential and commercial locations, where most of the population resides, is the open burning of waste by citizens. Sensor data near such locations can help raise awareness of personal exposure to smoke, support urban and local bodies in identifying localised sources, and nudge towards collective action. Effective mitigation requires a shared responsibility framework involving policymakers, industry, urban planners, and the public, acknowledging that economic development and environmental protection must progress concurrently.
Role of resident groups in monitoring air quality
Q: How can communities like RWA contribute to the hyperlocal AQ monitoring networks and how will they benefit from it?
- Active participation by non-regulatory or non-governmental groups, such as local residents, students, community groups, and civil society organisations, through ‘citizen science’ initiatives, can play a powerful role in establishing hyperlocal air quality monitoring networks.
- Citizen science shifts air quality monitoring from being solely regulator-driven to a participatory, community-based approach, where people directly contribute data and local knowledge. For instance, resident welfare associations (RWAs) can provide rooftops, community centres, or parks for hosting low-cost AQ sensors, ensuring coverage at the neighbourhood level.
- In addition, RWAs can track and record recurring local activities, such as garbage burning, construction dust, and traffic congestion, that trigger pollution spikes. This can help raise community awareness on the impact of everyday actions and help urban and local bodies identify and address localised sources of pollution.
Local monitoring and governance
Q: Based on the findings, how do you think governments can be convinced to better utilise clean air funds to address air quality issues? How can they invest this fund?
- As the first line of action to improve air quality, local governments should invest in systematically monitoring major emission sources, periodically updating emission inventories, and understanding source contributions.
- In parallel, it is essential to institutionalise behavioural changes and awareness campaigns. One effective way to do this is to translate AQ data into simple, understandable information and communicate it through dashboards, mobile applications, and other media channels. Such training could also be incorporated into the school curriculum.
- In Bengaluru, transport is the main source of air pollution, underscoring the need to strengthen public transport, reduce private vehicle use, and improve road maintenance to curb dust and vehicular emissions.
- Construction-related pollution is rising, but enforcement remains weak. Despite having the Construction and Demolition (C&D) waste management rules and construction guidelines (2017 and 2025), Bengaluru lacks a robust implementation framework for C&D waste management. The city has operational C&D processing plants at Kannuru and Chikkajala, but a few more are needed to manage the volume of waste generated.