As Bengaluru struggles with an ongoing water crisis, it reports a shortage of about 500 million litres of water every day. The significant water problem in the city is frequently blamed on insufficient rainfall, unregulated groundwater exploitation, and environmental negligence. However, it is essential to investigate water contamination, notably from sewage and industrial effluents, as a major cause of the water crisis. The focus then moves to Shivpura Lake in the Peenya Industrial Area.
Although a key industrial area, Peenya is neglected, as evidenced by its poor infrastructure and pollution issues. Shivpura Lake, in particular, is contaminated by the surrounding industry, reducing its water quality. Analysis of water quality data showed high levels of – Biological Oxygen Demand (BOD), which measures how oxygen is required by organisms, mainly bacteria, to break down the waste along with total coliform, which shows potential contamination of pathogen and faecal matter, and alkalinity, particularly during the monsoon season.
Addressing water contamination in industrial areas such as Peenya is critical not just for protecting the ecological integrity of water bodies, but also for promoting the long-term development of Bengaluru’s industrial sectors.
It is also important to understand how, within water bodies, contamination is not just limited to an affected water body, but also travels further to contaminate other water bodies that may share the same catchment area, or fall on the same channel network. We dissect this phenomenon, taking the case of Shivpura Lake in Peenya Industrial Area.
In this article, we have combined a variety of visualisations, including charts and elevation models, to demonstrate contamination patterns and emphasise the importance of focused environmental management.
The article proposes combining industrial expansion with responsible environmental measures, like effluent treatment and regulated waste disposal, to reduce pollution. It also promotes sustainable behaviours through awareness campaigns and community engagement.
Neglect and pollution: The condition of the Peenya Industrial Belt
Established in the 1970s, the Peenya Industrial Belt includes many of Bengaluru’s major industrial areas, such as Peenya, Yeshwanthpura, Rajajinagar, Jalahalli, Gotaguntepalya and Dasarahalli. With over 7,500 registered industries in the area, Peenya today paints a picture of sheer neglect. Characterised by its poorly maintained roads, irregular water and power supplies, improper garbage disposal and management, a sparsely gridded and poorly maintained drainage system, Peenya, today, is also a site of heavily polluted lakes and groundwater.
Shivpura Lake, one of the few water bodies in Peenya, has also been subject to such instances of neglect. It is regularly dumped with garbage and sewage and effluents from nearby industries.
The Peenya Industrial Area, one of the largest industrial zones in South-east Asia, has a significant manufacturing footprint in Bengaluru, as shown in the Economic Census of India 2013-14 (Figure 1).
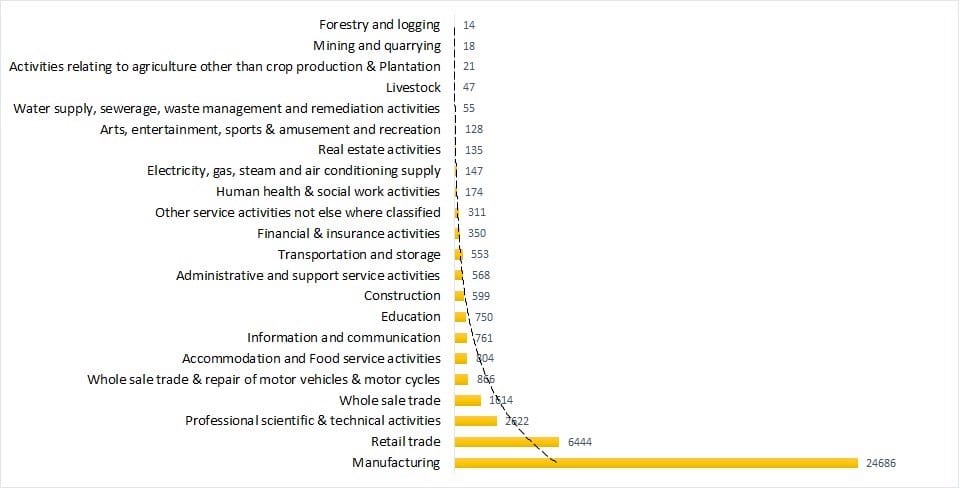
The horizontal bar chart in this figure clearly demonstrates the dominance of manufacturing, among other sectors, in the region, with a minimal percentage of enterprises operating out of residential premises (Figure 2).
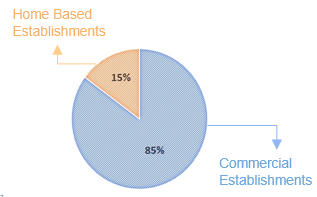
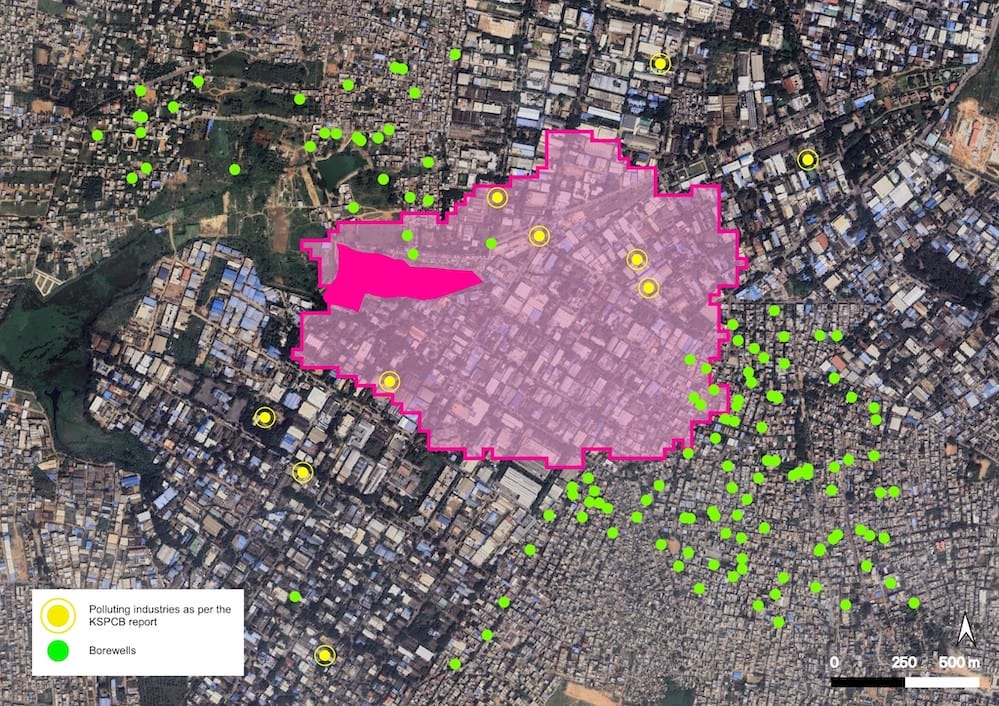
Peenya houses MSMEs, which are primarily located in residential areas and industrial spaces. In the study area, some of the polluting industries (identified by the Karnataka State Pollution Control Board (KSPCB) are not connected to the drainage grid system or are situated right next to the stormwater drain (SWD) (main map); because of which most sewage and industrial effluents in this industrial region are let out into SWDs (locally called ‘rajakaluves’) either directly or through the main sewer trunk lines from where they enter the local lakes.
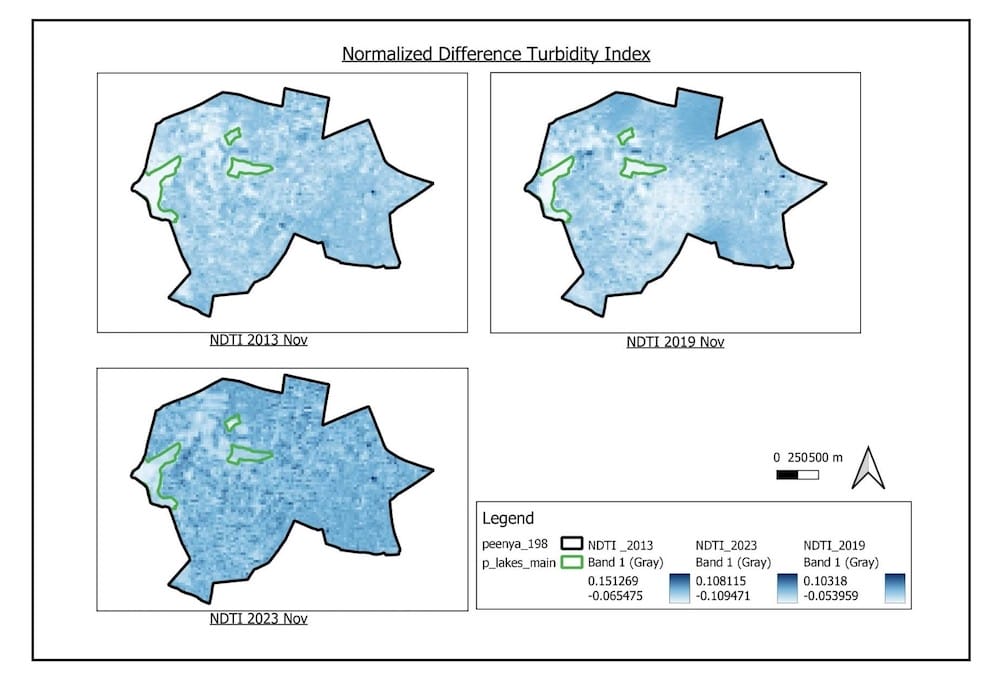
To further analyse this, we observed the turbidity index in Shivpura and Narasappanahalli lakes. The presence of sediments and pollutants in the water causes turbidity, which slowly precipitates on the lake bed. The normalised difference turbidity index (NDTI) is widely used to identify water turbidity. We can observe an increase in turbidity from 2013 to 2023, which indicates the presence of pollution (Figure 3).
Turbidity and heavy metal pollution in Peenya: A study of Shivpura and Narasappanahalli Lakes
This study in the Peenya industrial area shows high and legally unacceptable levels of heavy metals in the streams of the rajakaluves. Currently, the Bruhat Bengaluru Mahanagara Palike (BBMP) has concretised the rajakaluves around Peenya as a ‘band-aid’ fix, but not the surrounding lakes. Runoff and SWDs drain into these lakes, making them one of the major sources of groundwater contamination.
Chaotic governance structure
Governance issues and overlapping jurisdictions over the SWDs and lakes have further complicated their maintenance.
Currently, while the ownership of the lakes and SWDs comes under the BBMP, the KSPCB is responsible for monitoring and regulating industrial effluent disposal. Along with this, the BWSSB’s responsibility is to identify the residential units discharging sewage directly into SWDs and connect them to the grid.
This fragmented, chaotic governance structure has led to a lack of coordination and a standard governance philosophy across these entities that results more in blame games than concrete plans of action.
Read more: Whom do you call to fix your lake?
Environmental Impact Assessment: Water quality analysis of Shivpura Lake
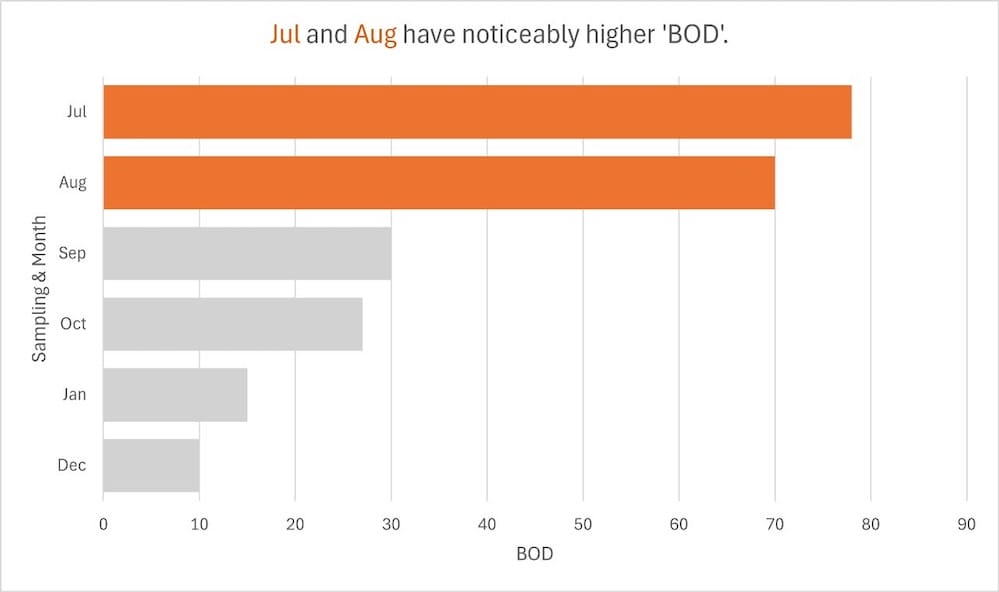
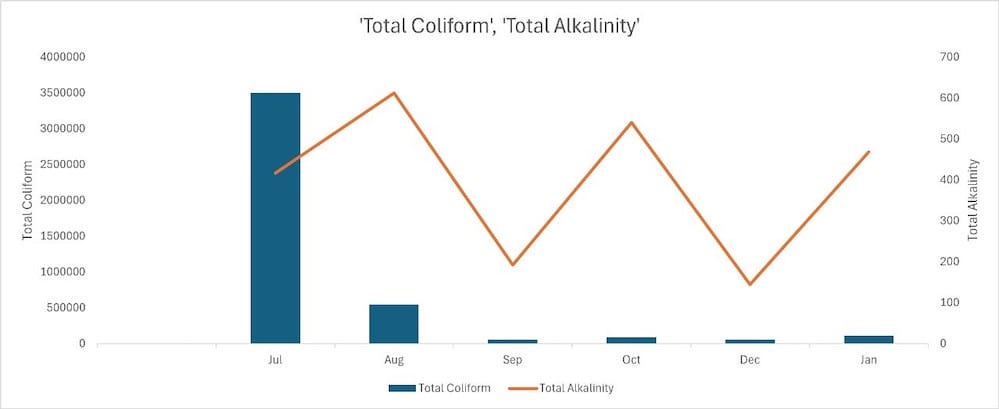
Recent water quality reports from the KSPCB raise concerns about the environmental effects of such industrial activities on the surrounding water bodies, particularly on Shivpura Lake. A focused analysis of monthly water quality levels from July 2023 to January 2024 reveals that the lake experiences its highest levels of BOD during July and August (Figure 4). These months coincide with the monsoon season, suggesting that increased rainfall could be contributing to higher levels of organic waste entering the lake through runoff.
In addition to BOD, the data shows alarming spikes in the total levels of coliform and alkalinity during the same period (Figure 5). This increase in coliform bacteria is an indicator of sewage and animal waste contamination, which poses major threats to public health and the ecosystem. The rise in alkalinity could be attributed to the washing away of minerals and pollutants into the lake due to heavy rains.
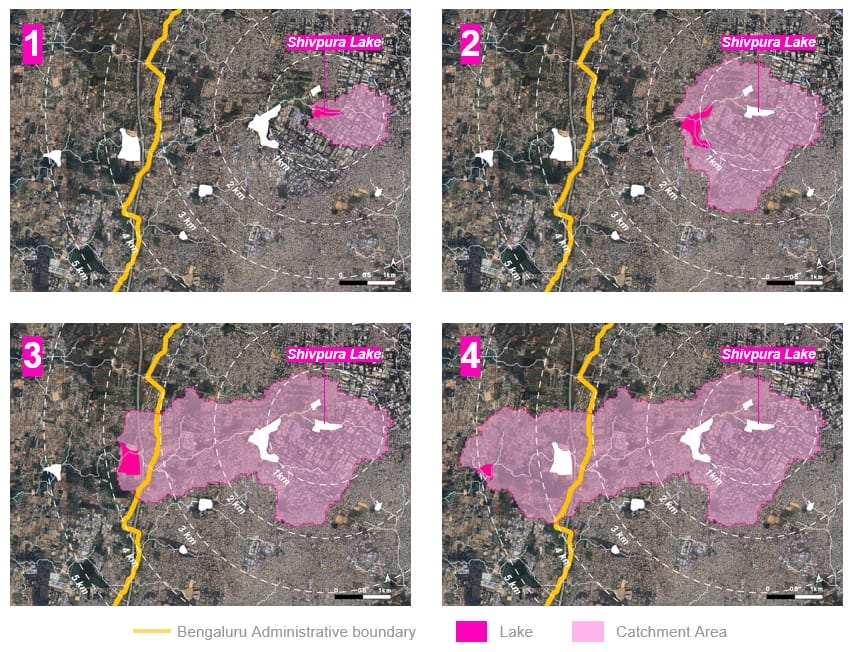
The contamination dynamics of Shivpura Lake are further elaborated through an elevation and upslope area analysis derived from the SRTM Digital Elevation Model (Figure 6) using GIS. This series of images illustrate how the catchment area, the land from which water drains into the lake, changes with topography and elevation. This data is pivotal in understanding the potential paths through which industrial pollutants can travel to the water body.
The presented figures and their corresponding data emphasise the need for targeted environmental management in industrial regions. They indicate that significant pollution occurs particularly during the monsoon months, suggesting a temporal pattern to the lake’s contamination that requires seasonal management strategies.
Way forward
By integrating industrial development with environmental considerations, such as effluent treatment and regulated waste disposal, the area can address the highlighted concerns. Awareness campaigns and community engagement are also crucial in promoting responsible practices. These steps will not only preserve the ecological integrity of water bodies like Shivpura Lake but also support the sustainable development of Bengaluru’s industrial sectors.