The blanket of haze that shrouds most big cities in India has grown denser as air quality continues to dip. Last winter was no different with pollution levels soaring way above permissible limits and posing major risks to public health.
A recent analysis of winter pollution during 2024-25 by the Centre for Science and Environment (CSE) highlights alarming pollution trends in India’s megacities, with Delhi leading with the worst air quality. Even megacities outside the Indo-Gangetic Plains (IGP) have seen escalating air quality challenges, despite relatively favourable climatic conditions. One significant trend across cities like Kolkata, Mumbai, Hyderabad, Chennai, and Bengaluru is the increase in localised pollution.
The report analysed PM2.5 data from October 1st to January 31st over the past four winters. As cities and their residents grapple with the debilitating symptoms of pollution-related illnesses, these findings call for stringent measures and targeted action to tackle poor air quality.
According to the World Health Organization (WHO) guidelines, 5 micrograms per cubic metre (µg/m3) is the recommended level of PM2.5 annually and 15 µg/m3 in 24 hours.
What are PM2.5 pollutants?
Fine particulate matter in air less than 2.5 microns in diameter are called PM2.5 pollutants. These pollutants are mostly released during the burning of oil, fossil fuels or wood, which means that vehicular and industrial emissions are the major source of PM2.5 pollutants.
Read more: Air pollution havoc: The many ways in which poor air is threatening our children’s lives
Overall highlights from the study
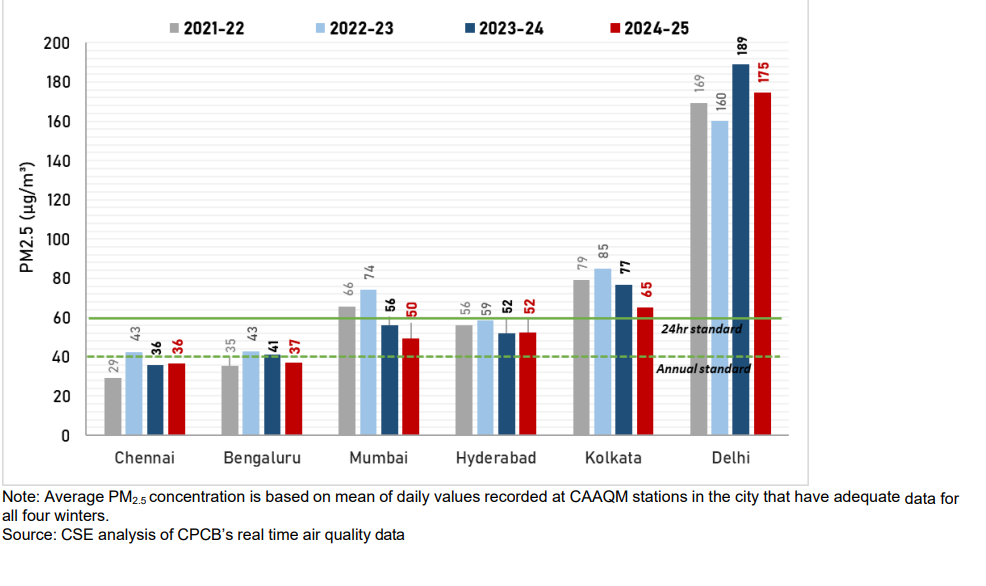
- Delhi’s worsening air quality: With a winter average PM2.5 level of 175 µg/m³, Delhi continues to top the list of most polluted Indian megacities. Its peak daily pollution level this winter, 602 µg/m³, marked the highest in four years.
- Comparative city rankings: Kolkata ranked second with a winter average of 65 µg/m³, followed by Hyderabad (52 µg/m³), Mumbai (50 µg/m³), Bengaluru (37 µg/m³), and Chennai (36 µg/m³).
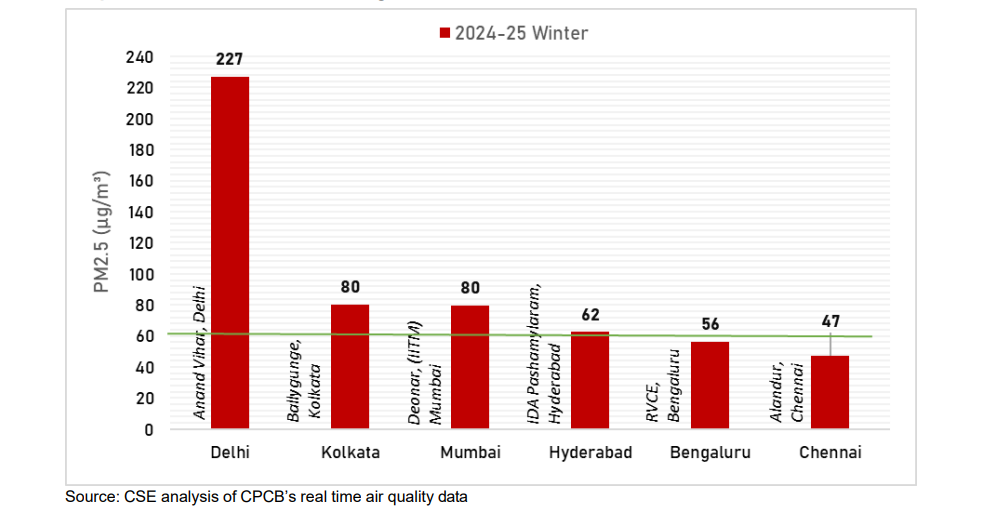
- Localised hotspots: In each city, pollution levels at specific locations were 19–60% higher than the citywide averages, with Mumbai’s Deonar and Kolkata’s Ballygunge showing the highest seasonal PM2.5 averages (80 µg/m³).
- Progress and setbacks: Cities such as Hyderabad, Mumbai, and Kolkata demonstrated significant reductions in their PM2.5 levels compared to previous years, while Bengaluru and Chennai recorded worsening pollution trends.
- Monthly trends: Air quality patterns varied, with November being the most polluted month in Delhi and Hyderabad, while Kolkata, Bengaluru, and Chennai saw their worst air quality in January, and Mumbai peaked in December.
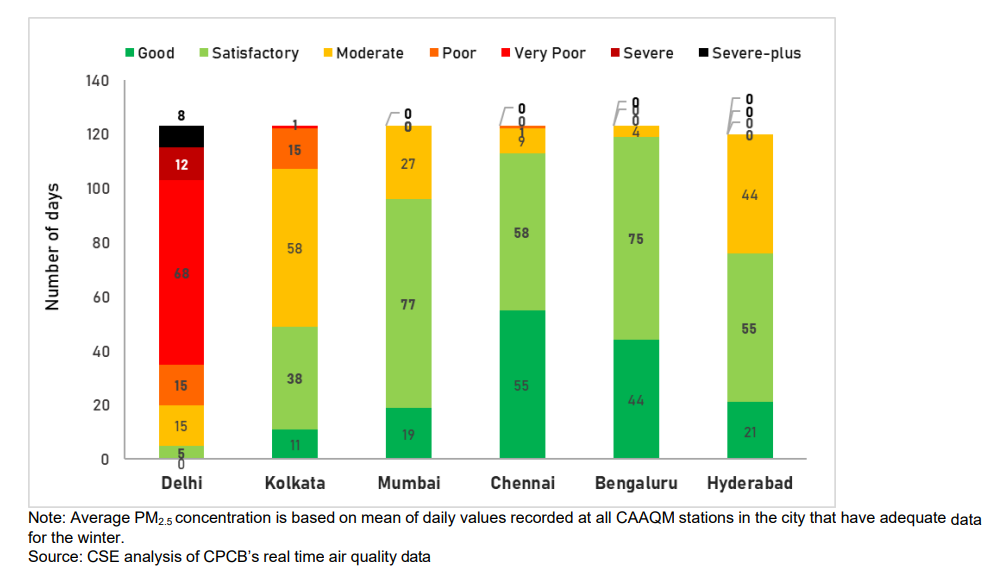
- ‘Good’ and ‘poor’ AQI days: Chennai recorded 55 “good” AQI days, the highest among megacities, while Delhi saw eight days of “severe+” AQI, 12 days of “severe” AQI, no “good” AQI days and 15 days of “poor” AQI, matched only by Kolkata.
- Changes compared to previous years:
- Delhi recorded a 7% reduction in pollution levels compared to the previous winter but was still 5% higher than in 2021-22.
- Mumbai, Kolkata, and Hyderabad saw improvements, with PM2.5 levels dropping by 16%, 14%, and 16%, respectively.
- Bengaluru and Chennai recorded increases in PM2.5 compared to 2021-22.
Major factors for pollution
Across cities, the growing number of vehicles on city roads and increasing vehicular emissions have been flagged as major reasons for worsening air quality. The CSE report highlighted that road traffic is a significant contributor to PM2.5 levels in cities, particularly during winter, exacerbating pollution levels due to heating needs and vehicular emissions. Similarly, a Greenpeace study released in December 2024, emphasises that vehicular emissions, particularly nitrogen oxides (NO2), are a top contributor to air pollution, with cities like Hyderabad and Bengaluru seeing significant traffic-related NO2 emissions.
Studies across major Indian cities have also highlighted the growing trend of localised pollution hotspots within cities. A November 2024 study by Respirer Living Sciences revealed that traffic corridors and industrial hubs were responsible for localised spikes in pollution especially in Delhi, Mumbai and Bengaluru.
Comparable trends across cities
- Winter peaks and localised pollution: Most cities experienced significant local spikes in pollution, suggesting that localised sources like transport and construction play a key role.
- Variation in improvement: Cities like Hyderabad and Bengaluru showed improvement, while Delhi, Kolkata, and Chennai saw minimal progress or worsening pollution levels. Among 68 monitoring stations across five megacities, Mumbai had four of the six most polluted locations, while Kolkata had the remaining two.
- Need for comprehensive measures: Across all cities, stronger emission control, better transportation management, and stricter regulations are essential to combat growing air pollution.
- Percentage increases in pollution (worst location vs. citywide average):
- Chennai: 30% higher
- Bengaluru: 51% higher
- Mumbai: 60% higher (highest disparity)
- Hyderabad: 19% higher
- Kolkata: 23% higher
- Delhi: 30% higher
Key findings for each city
Delhi
- What the report says about the city:
- Delhi recorded the highest average PM2.5 level of 175 µg/m³, with significant improvement over the previous year but still higher than the three-year average.
- The highest daily PM2.5 level spiked to 602 µg/m³, a 65% increase from the previous winter. CRRI Mathura Road saw a 20 per cent increase in winter pollution concentration, while Anand Vihar remained the most polluted location.
- Why this matters:
- Delhi continues to experience the worst pollution levels among Indian megacities, posing severe health risks.
- City-specific recommendations:
- Strengthen emission control measures from transport, industries, and waste burning.
- Intensify efforts in pollution management, considering both local sources and meteorological effects.
Kolkata
- What the report says about the city:
- Winter PM2.5 levels averaged 65 µg/m³, with stagnation in pollution levels, showing minimal improvement compared to previous winters. Across locations, PM2.5 concentrations were 29-37 per cent higher than annual averages.
- The peak winter pollution level reached 135 µg/m³, remaining under the “poor” AQI category. Victoria and Fort William recorded a sharp rise in NO2 levels.
- Why this matters:
- Despite improvements in other cities, Kolkata’s air quality remains hazardous, especially with consistently high winter pollution.
- City-specific recommendations:
- Focus on controlling vehicular emissions and industrial pollutants.
- Enhance real-time air quality monitoring to better manage localised pollution spikes.
Mumbai
- What the report says about the city:
- Mumbai’s winter average PM2.5 level was 50 µg/m³, showing a 12% drop from the previous year, but still above safe limits.
- Deonar, Shivaji Nagar and Malad West were the most polluted while Kurla, Khindipada, Colaba and Vile Parle West saw improved air quality compared to the previous year.
- Why this matters:
- Despite improvement, pollution in Mumbai continues to be a public health concern due to persistent levels.
- City-specific recommendations:
- Increase enforcement of regulations on vehicular emissions.
- Promote cleaner industrial practices and stricter waste management protocols.
Hyderabad
- What the report says about the city:
- Hyderabad recorded a significant reduction of 51% in PM2.5 levels, with winter levels down to 89 µg/m³. It saw the largest improvement in pollution levels among the cities.
- Sanathnagar recorded the highest daily pollution peak at 182 µg/m³ while IITH Kandi, Somajiguda, and ICRISAT saw the highest spikes in PM2.5 levels this winter.
- Why this matters:
- The improvement in Hyderabad indicates that targeted actions can result in significant air quality benefits.
- City-specific recommendations:
- Continue the focus on improving public transportation and reducing industrial emissions.
- Strengthen urban green cover to act as a natural pollutant filter.
Bengaluru
- What the report says about Bengaluru:
- Bengaluru’s winter PM2.5 levels averaged 37 µg/m³, showing an increase from 2021-22, despite some improvements.
- The highest daily PM2.5 level was 67 µg/m³ on November 1, 2024, a 40% reduction from past winter peaks.
- RVCE, Peenya, BTM Layout and Jigani saw the highest rise in pollution levels.
- Why this matters:
- Although better than some cities, Bengaluru is seeing a rise in localised pollution, necessitating ongoing vigilance.
- City-specific recommendations:
- Promote sustainable transport options and curb construction-related dust.
- Implement more effective monitoring and pollution control systems for growing urban sectors.
Chennai
- What the report says about Chennai:
- Chennai’s winter average PM2.5 was 36 µg/m³.
- The highest daily PM2.5 level recorded was 119 µg/m³ on October 31, 2024, a 19% decrease from past winter peaks. Velachery station reported a peak of 193 µg/m³
- Peak pollution levels showed minimal change, remaining in the “poor” AQI category.
- Why this matters:
- Despite marginal improvements, Chennai’s pollution levels remain a significant concern, requiring sustained action.
- City-specific recommendations:
- Improve waste-burning regulations and enforce stricter emission standards for industries.
- Increase awareness campaigns to reduce local sources of pollution.
The study recommends that the National Clean Air Programme ensure all cities in different climatic zones take appropriate and stringent action to prevent winter spikes and meet clean air standards.
Key recommendations from the study
- Implement stricter regulations and enforcement across all pollution sources to mitigate pollution levels, especially in high-risk areas.
- Cities like Delhi and Kolkata, with adverse meteorological conditions, need enhanced strategies to combat worsened pollution due to weather patterns.
- Expand air quality monitoring networks in cities and ensure comprehensive data coverage for better pollution trend analysis.
- Increase public awareness about pollution risks and promote measures like reducing vehicle emissions and using cleaner technologies.
- Invest in sustainable urban planning, including better public transportation systems and green spaces, to reduce pollution in the long run.