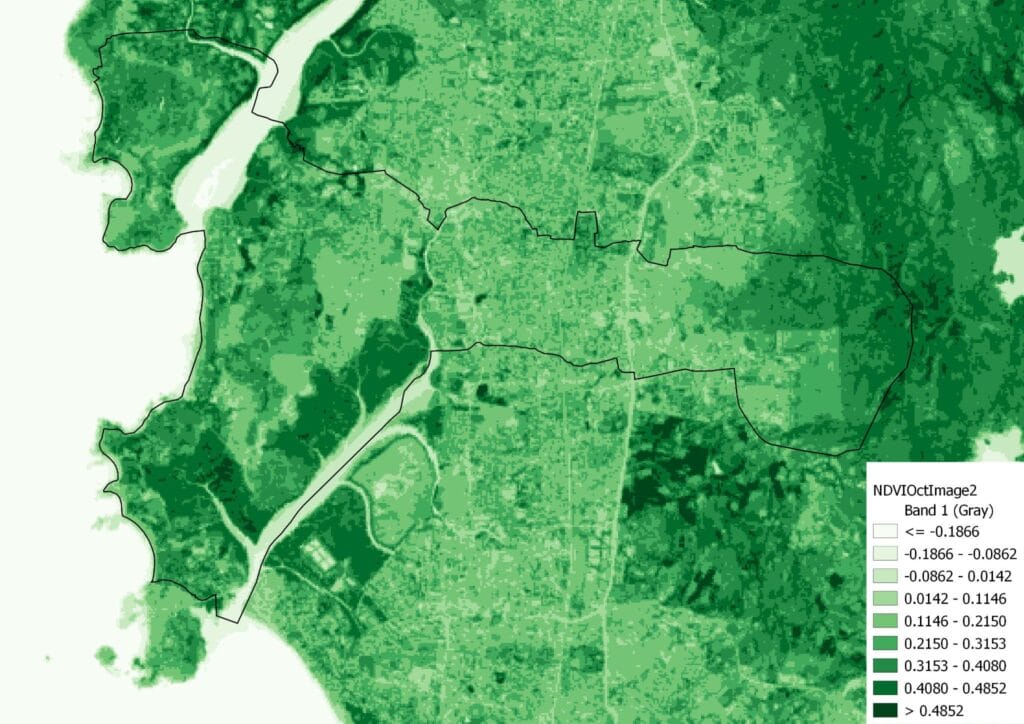
Mumbai’s P/North Ward is a climate paradox. On a map, it looks green, boasting significant cover from the Sanjay Gandhi National Park to the east and vital mangroves to the west. Yet, the reality on the ground for its nearly one million residents is one of scorching heat. The surfaces people walk and live on have heated dramatically, with land surface temperatures soaring by over 5°C in much of this ward between 2015 and 2024.
The reason is a familiar story of urban expansion: rapid, unplanned growth has replaced cooling ecosystems with a dense fabric of concrete, tin, and asphalt, creating severe urban heat islands. This is most acutely felt in the ward’s high-density informal settlements, where the most vulnerable populations face the greatest risk.
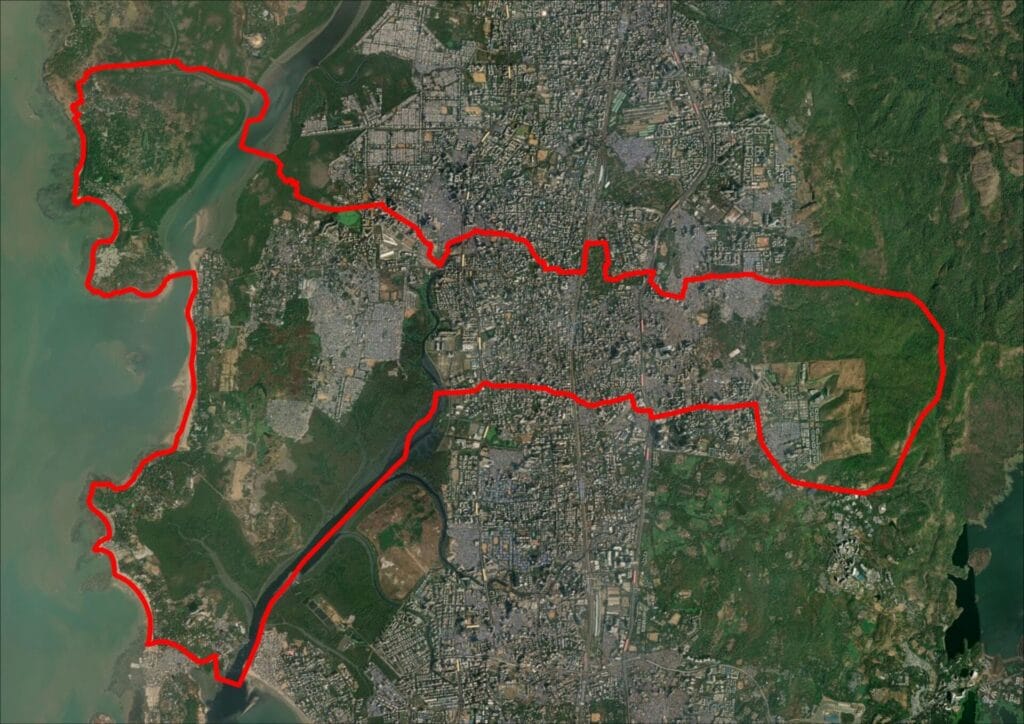
Where is P/North, and why does it matter?
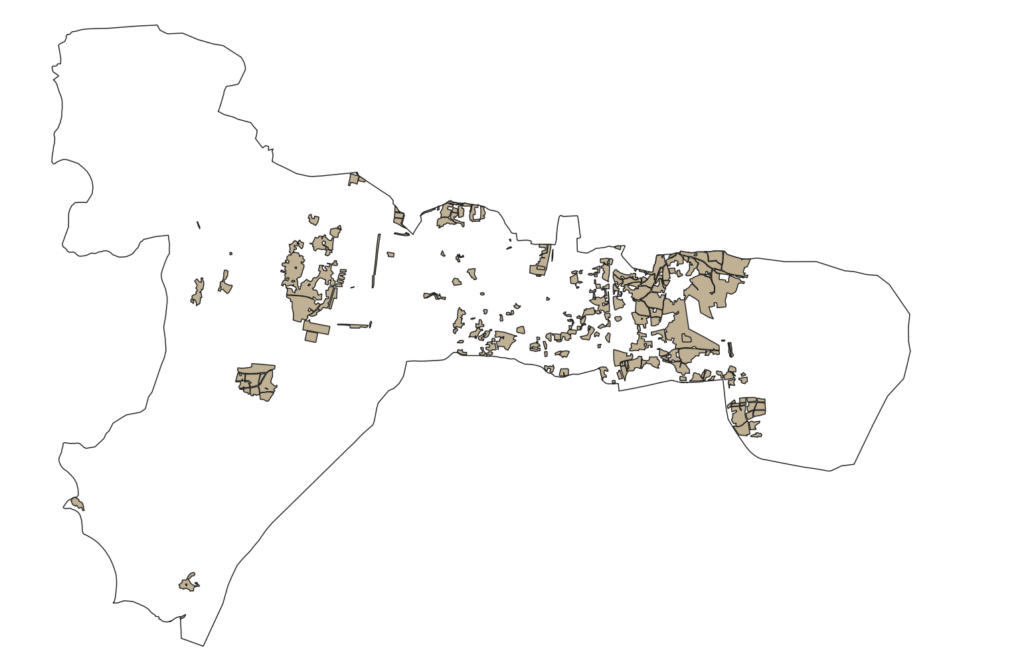
Covering an expansive 46.67 sq. km, Mumbai’s P/North Ward is a region of immense contrasts. It stretches from the forested hills of the Sanjay Gandhi National Park to the coastal mangroves of Madh and Manori, encompassing major localities like Malad, Malvani, Madh, and Aksa.
It is the most populous ward in Mumbai according to the 2011 census and the second largest by area. This means that every degree of warming here potentially affects more people than anywhere else in the city, making its climate trajectory a critical concern.
The core problem: Climate resilience in decline
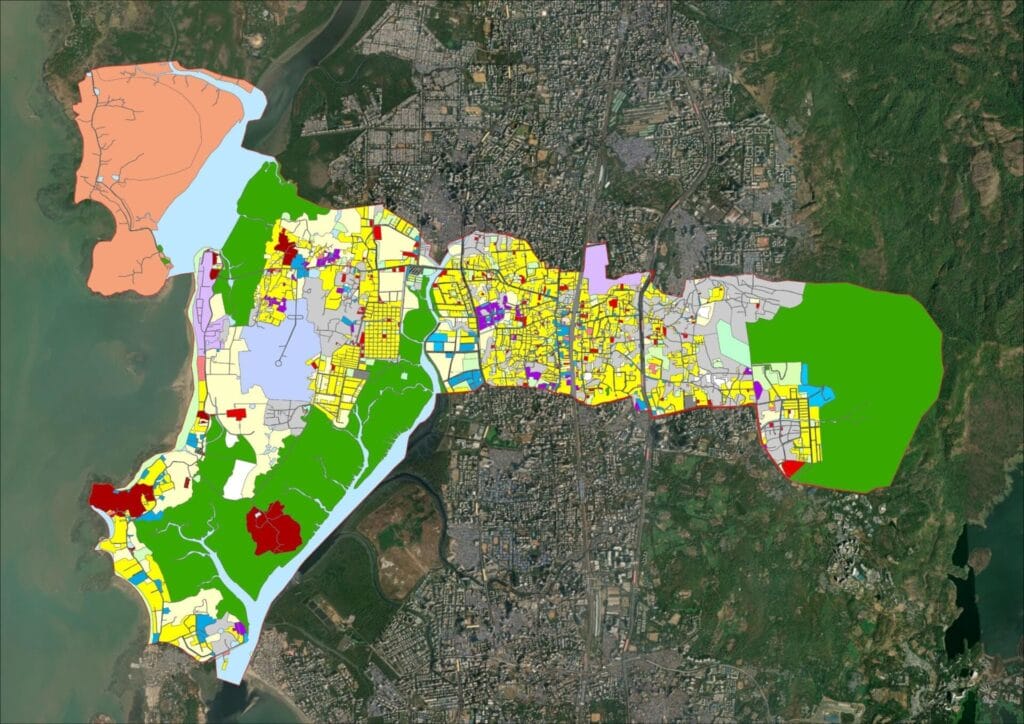
The central issue is the erosion of the ward’s natural climate resilience. This is driven by two interconnected problems: unchecked illegal construction and rapid land-use changes that intensify heat risk for a large and vulnerable population. While natural areas still make up a third of the ward, the built-up environment is expanding at a pace that outstrips climate-responsive planning, leaving a scarcity of open spaces and social amenities that could mitigate heat.
The population density is highly uneven, peaking in the central part of the ward while being lower in the coastal areas of Madh and Manori. This concentration of people in rapidly densifying corridors is a recipe for escalating heat exposure.
Read more: Hotspot of climate inequality: How Mumbai’s M/East Ward suffers from extreme heat
How we measured risk
Our analysis follows the standard Risk = Hazard x Vulnerability x Exposure framework to understand the impact of rising urban temperatures. This approach allowed us to systematically measure the threat, identify susceptible populations, and pinpoint where the impacts are most severe.
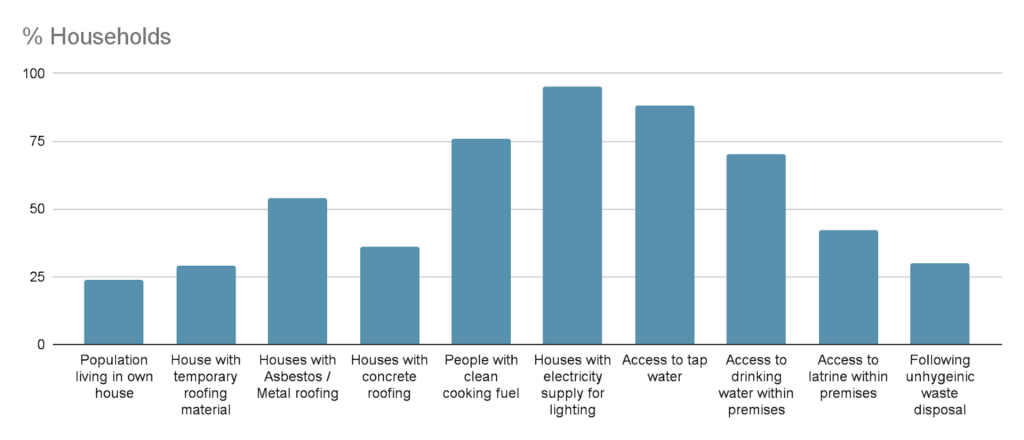
Vulnerability was assessed using household demographic data. We focused on critical indicators such as the type of roofing material (e.g., heat-absorbing asbestos or metal), the kind of cooking fuel used, and access to essential services like clean water, electricity, and healthcare.
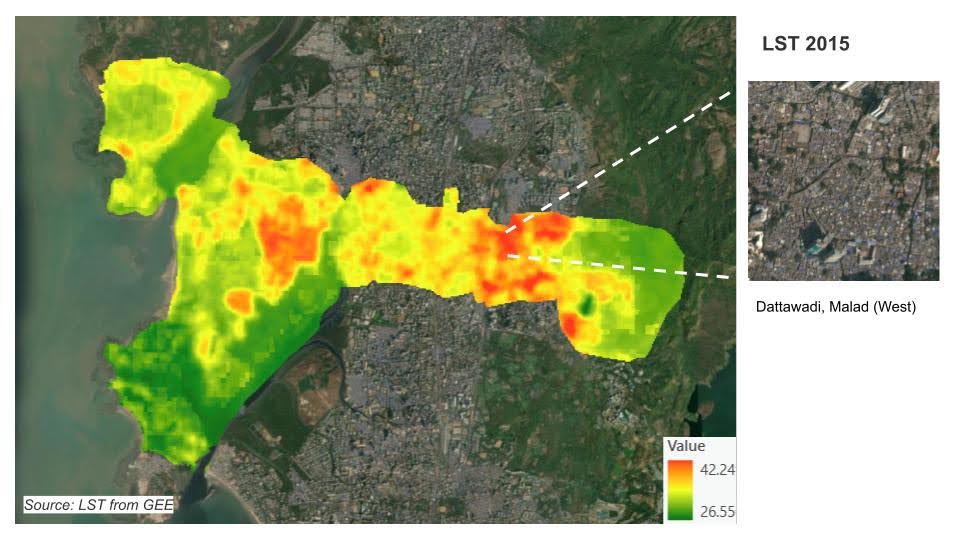
Hazard: We defined the primary hazard as the increase in extreme heat. To measure this, we analysed the change in Land Surface Temperature (LST) over time. We processed multi-year Landsat 8/9 satellite scenes in Google Earth Engine, creating cloud-masked, dry-season median temperature maps for 2015 and 2024 and then calculated the difference.
Vulnerability and exposure: To understand who is most vulnerable and where they are exposed, we looked at two key areas:
- Exposure was mapped by overlaying land-use data and the geographic distribution of high-density informal settlements (slums) to see how land-use changes correlate with heat increases.
- Vulnerability was assessed using household demographic data. We focused on critical indicators such as the type of roofing material (e.g., heat-absorbing asbestos or metal), the kind of cooking fuel used, and access to essential services like clean water, electricity, and healthcare.
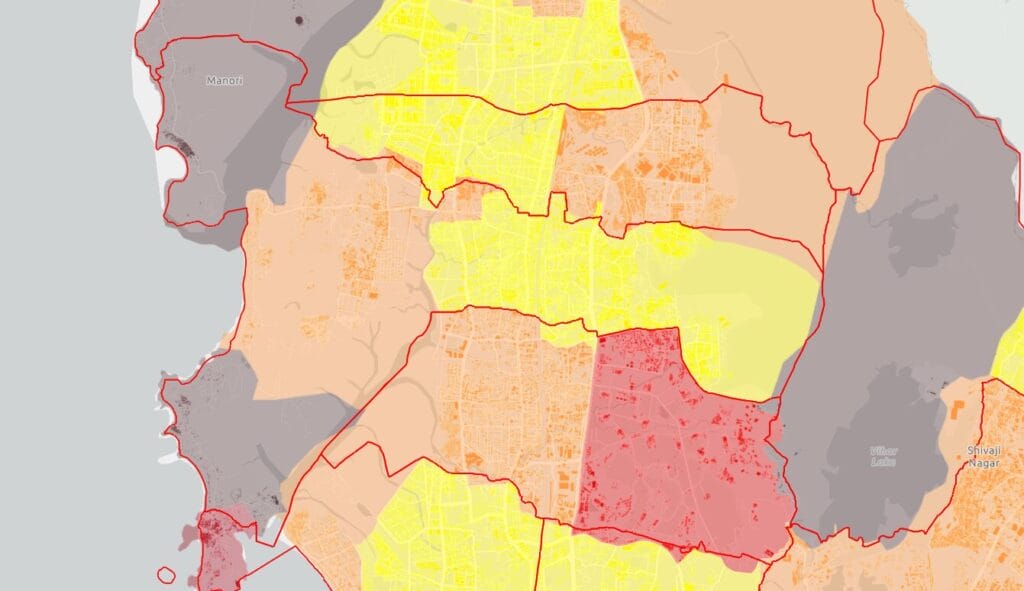
Pic: ArcGIS Living Atlas Data source: ESRI Visualisation: Team P/North.
The data: Tracking the rising heat
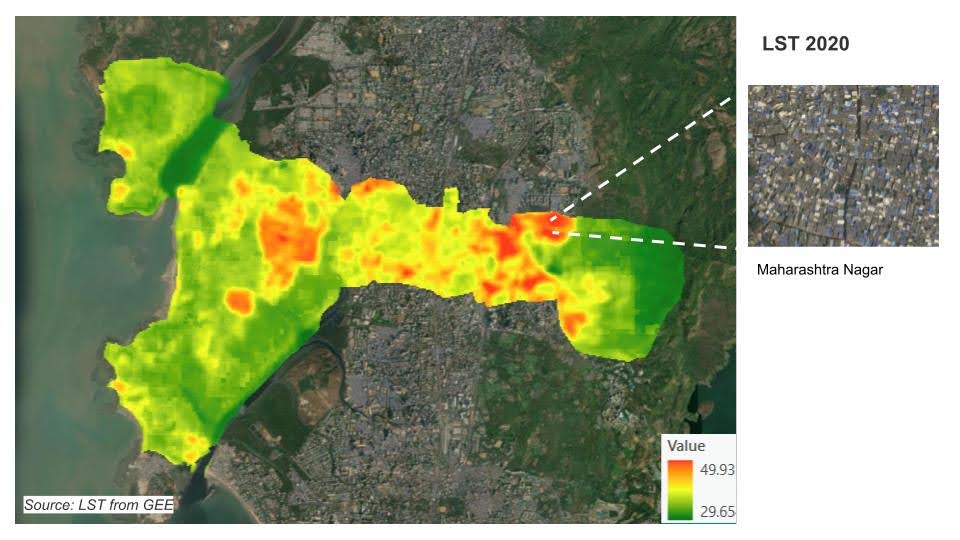
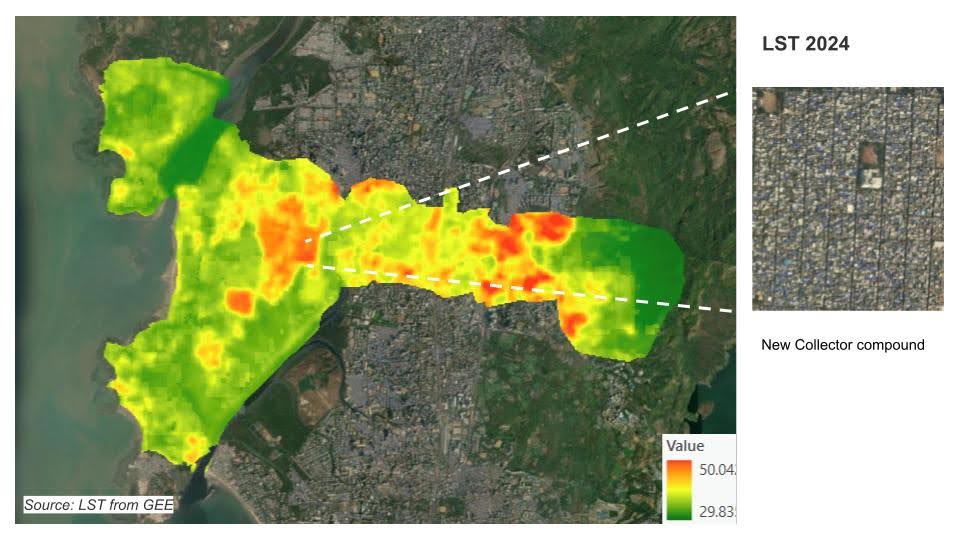
An analysis of Land Surface Temperature (LST) using satellite data from 2015 to 2024 reveals a stark warming trend. In October 2015, the maximum temperature recorded was 42.24°C. By 2024, it had crossed the 50°C mark. This isn’t a uniform temperature rise; specific hotspots have emerged in densely populated areas like Dattawadi, Maharashtra Nagar, and the New Collector Compound.
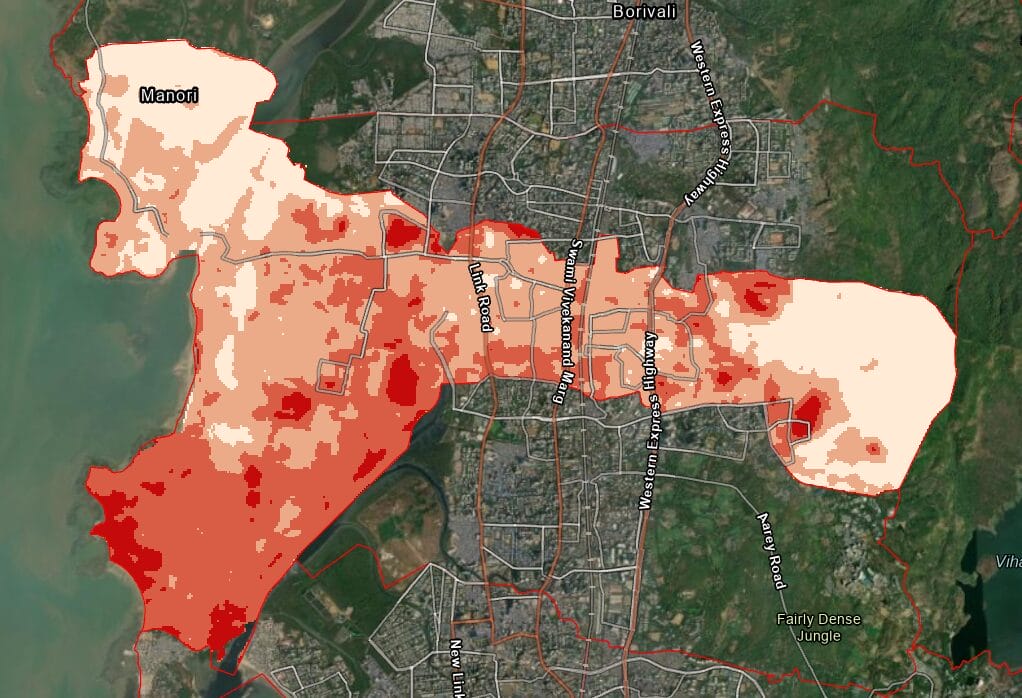
A difference map plotting the change between 2015 and 2024 shows that approximately 60% of the ward has warmed by more than 5°C. Critically, the sharpest temperature jumps are seen along the mangrove fringe, where debris dumping and reclamation have replaced cooling, moist ecosystems with heat-absorbing landfill and tin-roof housing.
The most vulnerable: Heat risk in informal settlements
The impacts of this rising heat are not distributed equally. The highest temperatures are concentrated in the ward’s informal settlements, where a confluence of factors creates extreme vulnerability. About 26% of housing in P/North has roofing materials like asbestos and metal, which are vulnerable to urban heat. Furthermore, around 25% of homes use cooking fuels that generate significant internal heat.
Compounding this, only 25% of the population lives in their own houses, indicating a large rental community with less capacity to make structural improvements. This is exacerbated by limited access to healthcare and a high number of flooding hotspots, making P/North one of Mumbai’s most vulnerable wards to the combined impacts of climate change.
What should Mumbai do? Recommendations for a cooler future
The situation in P/North Ward demands urgent, multi-pronged action. Here are four key recommendations:
1. Restore and legally protect natural ecosystems
The ward’s natural air-conditioning is being switched off just where it’s needed most. It is crucial to strengthen mangrove buffer zones in Gorai, Manori, and Marve with fencing, native replantation, and community-based monitoring to prevent further encroachment. Fixing tidal flow by desilting culverts should be a priority before replanting begins.
2. Mandate UHI-sensitive redevelopment
As the ward redevelops, particularly through Slum Rehabilitation Authority (SRA) projects, new regulations must be mandated. This includes requiring tree cover, passive cooling designs like cross-ventilation, and the allocation of at least 10-15% of plots to open green space. For existing slums, rolling out reflective-roof paint and providing shade sails in lanes can offer immediate relief.
3. Prioritise vulnerability management
The immediate needs of the most vulnerable must be met. This includes a basic housing mandate for reflective roofs instead of heat-trapping temporary materials and ensuring 100% household coverage of clean water, healthcare, and electricity. Awareness and education programmes, especially for women, are essential to prepare families for heat waves.
4. Expand tree plantation in public spaces
Open spaces along footpaths, road medians, and unused government plots should be utilised for extensive tree planting with native, drought-resistant species. Developing shaded walking and cycling routes along major arteries such as Link Road and Marve Road can maximise thermal comfort for pedestrians.