(In Part 1, data analysts explained how they arrived at a definition of water security. In Part 2, the analysts explained the methodology used in estimating the Cauvery index and the results have been obtained. In continuation, part 3 will explain the methodology used in estimating the remaining indices and its results)
Groundwater index
Borewell count: The OpenCity borewell dataset was used to map borewells into Bruhat Bengaluru Mahanagara Palike (BBMP) wards and compute the number of borewells per ward. Assuming an average yield of 5,000 litres/day, water supply from borewells was normalised with ward population and the wards were ranked by this normalised supply.
Groundwater extraction: Data from the Dynamic Groundwater Resources of Karnataka as of March 2022 was used to assess the groundwater extraction. The relevant table for Bengaluru (Annexure -VB [Page 114]) is reproduced below:
| District | Taluk | % over extraction | Categorisation |
| Bengaluru Rural | Devanahalli | 152 | Over Exploited |
| Bengaluru Rural | Doddaballapur | 157 | Over Exploited |
| Bengaluru Rural | Hosakote | 167 | Over Exploited |
| Bengaluru Rural | Nelamangala | 105 | Over Exploited |
| Bengaluru Urban | Anekal | 129 | Over Exploited |
| Bengaluru Urban | Bengaluru North | 170 | Over Exploited |
| Bengaluru Urban | Bengaluru South | 108 | Over Exploited |
| Bengaluru Urban | Bengaluru East | 239 | Over Exploited |
| Bengaluru Urban | Yelahanka | 157 | Over Exploited |
The wards were then mapped to the respective taluks. Lower groundwater extraction is desirable and hence wards with lower over extraction percentage were assigned a higher rank.
Groundwater quality: Data from the Karnataka State Groundwater Quality Evaluation Report -2018 was used. Table -12 water quality Data of Bengaluru Urban DIstrict 2018-2019 from the report has been reproduced below:
| District | Taluk | # of monitoring stations | Stations with non -potable water |
| Bengaluru Rural | Devanahalli | 6 | 17% |
| Bengaluru Rural | Doddaballapur | 9 | 30% |
| Bengaluru Rural | Hosakote | 5 | 20% |
| Bengaluru Rural | Nelamangala | 6 | 17% |
| Bengaluru Urban | Anekal | 7 | 70% |
| Bengaluru Urban | Bengaluru North | 14 | 57% |
| Bengaluru Urban | Bengaluru South | 7 | 67% |
| Bengaluru Urban | Bengaluru East | 6 | 50% |
| Bengaluru Urban | Yelahanka | NA | 57% |
The wards were then mapped to the respective taluks. As with the groundwater extraction, wards with a lower non-potable probability were assigned a higher rank.
Lake/tank area coverage: We analysed the BBMP wards dataset with QGIS to determine the percentage of area covered by lakes and ponds in each ward, using the Lakes and Ponds data from Open City.
Results
The ranks at the variable level were then added up and the wards were ranked again to arrive at the groundwater index. The results are plotted in the heatmap below:
A higher area covered by lakes and tanks is good in terms of groundwater rechargeability. Hence, wards with a higher area covered by lakes and tanks were assigned a higher rank.
| Ward # | Ward Name | Borewell Water supply (l/p/d) | Lakes/tanks % | Groundwater extraction | GW Quality | Rank | ||||
| Value | Rank | Value | Rank | Value | Rank | Non-potable probability | Rank | |||
| 106 | Marathahalli | 9.3 | 23 | 25% | 3 | 239% | 5 | 50% | 1 | 1 |
| 9 | Hebbal Kempapura | 8.9 | 28 | 13% | 7 | 170% | 4 | 57% | 2 | 2 |
| 101 | Dodda Nekkundi | 9.2 | 26 | 9% | 10 | 239% | 5 | 50% | 1 | 3 |
| 1 | Kempegowda Ward | 8.4 | 32 | 10% | 8 | 157% | 3 | 57% | 2 | 4 |
| 45 | Rajarajeshwari Nagar | 12.3 | 4 | 3% | 39 | 108% | 1 | 67% | 3 | 5 |
| 4 | Yelahanka Satellite Town | 11.3 | 9 | 3% | 35 | 157% | 3 | 57% | 2 | 7 |
| 10 | Byatarayanapura | 10.3 | 16 | 4% | 28 | 157% | 3 | 57% | 2 | 7 |
| 14 | Kuvempu Nagar | 14.4 | 3 | 2% | 44 | 157% | 3 | 57% | 2 | 8 |
| 213 | Jaraganahalli | 7.4 | 44 | 18% | 6 | 108% | 1 | 67% | 3 | 9 |
| 22 | Peenya Industrial Area | 8.7 | 30 | 6% | 20 | 170% | 4 | 57% | 2 | 10 |
| 58 | Kadu Malleshwar Ward | 0.3 | 201 | 0% | 95 | 170% | 4 | 57% | 2 | 216 |
| 82 | Banaswadi | 0.3 | 202 | 0% | 95 | 239% | 5 | 50% | 1 | 217 |
| 124 | Subhash Nagar | 0.3 | 203 | 0% | 95 | 170% | 4 | 57% | 2 | 218 |
| 57 | Rajmahal Guttahalli | 0.3 | 204 | 0% | 95 | 170% | 4 | 57% | 2 | 219 |
| 76 | Hennur | 0.3 | 205 | 0% | 95 | 170% | 4 | 57% | 2 | 220 |
| 117 | Vasanthnagar | 0.1 | 211 | 0% | 95 | 170% | 4 | 57% | 2 | 221 |
| 120 | Bharathi Nagar | 0.0 | 216 | 0% | 95 | 170% | 4 | 57% | 2 | 225 |
| 125 | Okalipuram | 0.0 | 216 | 0% | 95 | 170% | 4 | 57% | 2 | 225 |
| 150 | Attiguppe | 0.0 | 216 | 0% | 95 | 170% | 4 | 57% | 2 | 225 |
| 119 | Shivaji Nagar | 0.0 | 216 | 0% | 95 | 170% | 4 | 57% | 2 | 225 |
The results are displayed in the heatmap below:
- The blue end of the spectrum represents the best-performing wards
- The white end represents the worst-performing wards

- Wards which have been historically serviced by Cauvery water and hence less dependent on borewell supply appear to be ranked quite low in this index
- Some wards in the eastern and the south western areas rank very low, this is likely due to inadequate data on the actual number of borewells present
Land use index
Built up area: We used the land use maps – built-up vs unbuilt to arrive at the unbuilt area in each ward. Wards were ranked in ascending order of unbuilt area percentage – the more unbuilt area in a ward, the higher the ranking.
Results
The ranks for each variable (built-up area and commercial area) were then summed up individually. These totals were ranked again to determine the land use index/rank. The ward with the best performance in terms of the identified variables is ranked 1, while the ward with the worst performance is ranked 225. The table below provides the variable values and ranks for the top 10 and bottom 10 wards.
| Ward # | Ward Name | Unbuilt area % (lakes excluded) | Commercial land area % | Net Rank | ||
| Value | Rank | Value | Rank | |||
| 33 | Hemmigepura | 87% | 1 | 0% | 1 | 1 |
| 104 | Varthur | 80% | 2 | 0% | 1 | 2 |
| 208 | Anjanapura | 78% | 4 | 0% | 1 | 3 |
| 36 | Jalahalli | 78% | 5 | 0% | 1 | 4 |
| 172 | Agaram | 77% | 6 | 0% | 1 | 5 |
| 97 | Kadugodi | 73% | 9 | 0% | 1 | 6 |
| 210 | Kalena Agrahara | 72% | 11 | 0% | 1 | 7 |
| 31 | Bande Mutt | 71% | 12 | 0% | 1 | 8 |
| 203 | Subramanyapura | 71% | 13 | 0% | 1 | 9 |
| 44 | Jnana Bharathi ward | 70% | 14 | 0% | 1 | 10 |
| 189 | Ganesh Mandir ward | 18% | 156 | 70% | 208 | 216 |
| 197 | Srinagar | 7% | 207 | 29% | 158 | 217 |
| 154 | Rayapuram | 4% | 213 | 33% | 163 | 218 |
| 52 | Shakthi Ganapathi Nagar | 9% | 196 | 42% | 183 | 219 |
| 148 | New Guddadahalli | 12% | 181 | 67% | 199 | 220 |
| 55 | Malleswaram | 13% | 176 | 88% | 215 | 221 |
| 50 | Nalvadi Krishna Raja Wadiyar | 4% | 218 | 40% | 178 | 222 |
| 179 | Madivala | 4% | 216 | 50% | 187 | 223 |
| 79 | Kadugondanahalli | 6% | 209 | 60% | 198 | 224 |
| 153 | Padarayanapura | 1% | 225 | 46% | 185 | 225 |
The values plotted on to a heatmap is presented below:
- The blue end of the spectrum represents the best performing wards
- The white end represents wards which perform the worst
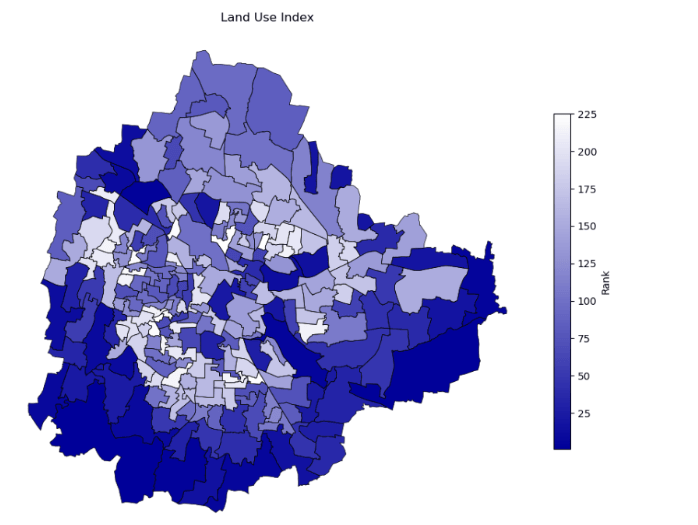
The peripheral areas particularly on the southern and eastern edges perform better on this index owing to less built-up and commercial area.
Governance index
The Bangalore Water Supply and Sewerage Board (BWSSB) contacts were obtained from their website and their office location details were geocoded. We then assigned these locations to their respective wards. We located the following wards where a BWSSB liaison officer was available.
| Ward Number | Ward Name |
| 100 | Garudachar Palya |
| 101 | Dodda Nekkundi |
| 102 | AECS Layout |
| 104 | Varthur |
| 107 | Bellanduru |
| 15 | Kammagondanahalli |
| 17 | Chikkasandra |
| 19 | T Dasarahalli |
| 203 | Subramanyapura |
| 206 | Konanakunte |
| 208 | Anjanapura |
| 209 | Gottigere |
| 212 | Naganathapura |
| 224 | Hosa Road |
| 225 | Kudlu |
| 26 | Dodda Bidarakallu |
| 27 | Lingadheeranahalli |
| 29 | Ullalu |
| 3 | Atturu |
| 33 | Hemmigepura |
| 5 | Kogilu |
| 7 | Thanisandra |
| 8 | Amrutahalli |
| 86 | Challakere |
| 87 | Horamavu |
| 97 | Kadugodi |
Having access to a BWSSB liaison officer is desirable. Therefore, the wards mentioned in the table above were assigned a rank of 1, while the rest of the wards ranked at 2.
(Part 4 of the series will highlight how to address the gaps in data to enhance Bengaluru’s water security)
(The other team members who contributed their insights for this article are: Swati Ganeshan, VishnuPriya Viswanathan, Ritika Gupta, Aniket Sawant, and Chandanapriya Dhanraj)