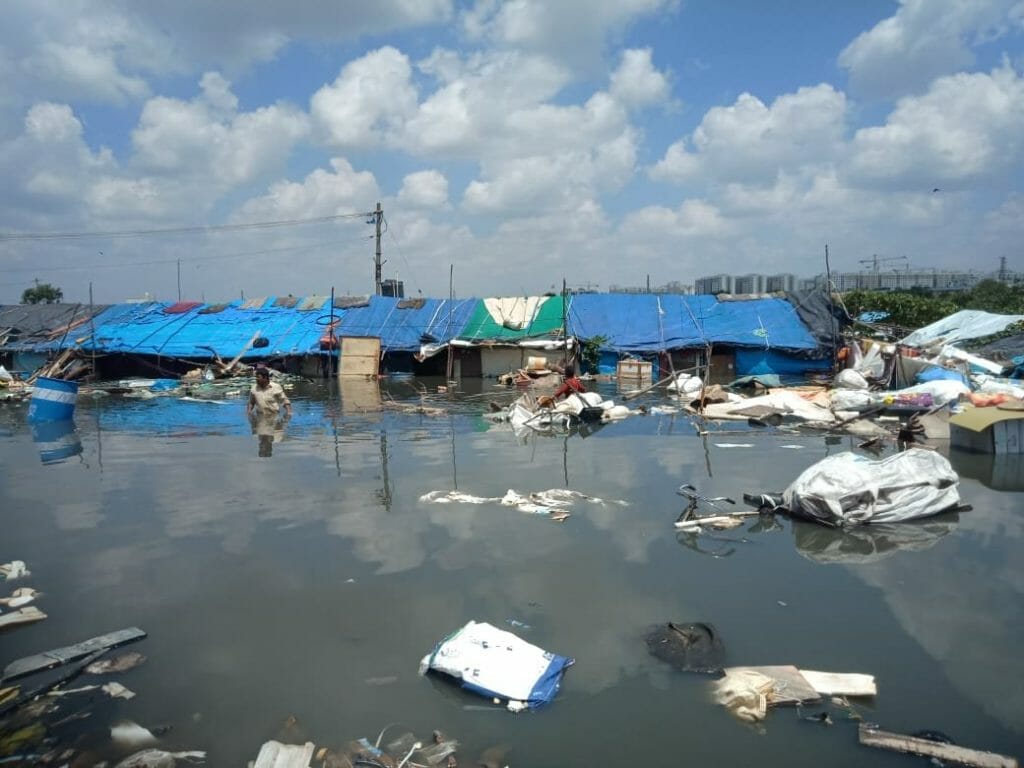
Bengaluru witnessed one of its worst floods in September this year. The city received more than 800mm rain, since June. Heavy rains led to flooding of many parts of the city in the east, southeast, and northeast, inundating neighbourhoods and houses and damaging vehicles. Tractors and boats were used to evacuate people from homes in flooded neighbourhoods.
Bengaluru’s IT corridor was among the worst affected. Large swathes of the city were flooded, normal life was disrupted, and the apathy of the authorities raised many questions.
In search of answers
Several reasons have been cited for the flooding: from rapid and unplanned urbanisation to poor infrastructure to burgeoning population to climate change. Citizens have been trying to find answers to what caused the floods and possible solutions to protect themselves in the event of another flood. Various experts have attempted to explain the cause for Bengaluru’s recent floods. News articles, TV panels, Youtube videos, and Twitter threads have attempted to analyse the cause for the severe flooding.
Read more: Disaster management in Bengaluru: Temporary fixes touted as solutions as city floods again
‘Floodsplaining’ series
One such explainer is by Arun Pai, Founder of Bangalore Walks. In a five-part video, titled “Floodsplaining Series”, on the Bangalore Walks Youtube channel, Arun deep dives into understanding the cause for the floods, providing compelling insights, using interactive maps, trivia and quizzes while maintaining a neutral stance.
In the first video, titled “Blr Floods- 2 mins explainer! Why Red v Blue Matters”, Arun explains why certain parts of Bengaluru are more prone to flooding than others.
Read more: An unequal monsoon: The impact of the floods on Whitefield’s poor settlements
Mapping the water path
Bengaluru primarily depends on rain as a water source. Arun Pai traces, via an interactive map, the flow of rain water from five different locations to Varthur Tank, the lowest point of the city, situated at a height of 865 metres above sea level, according to the video. The locations include: the highest point in the city, i.e. High Grounds near Raj Bhavan, near Cubbon Park, near Koramangala, south of Tin Factory, and east of Harlur. If anything comes in the way of the flow of the water, there is a good chance of flooding.
Watch the full video below and stay tuned as we bring you the subsequent parts:
[The video has been republished with permission]