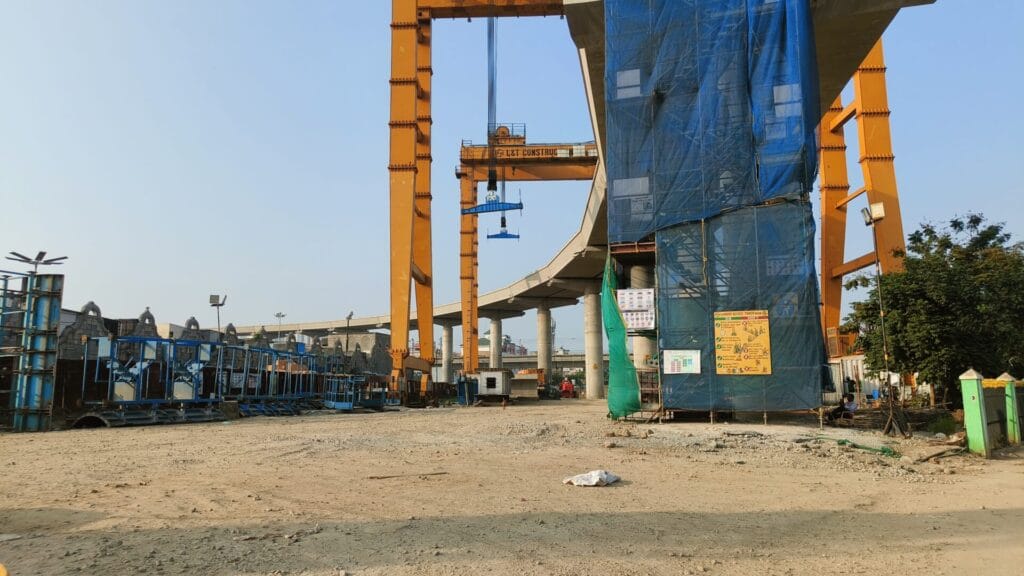
As sweater weather arrives, winter brings purple December flowers, fresh Ooty carrots with slivers of roots, and crisp Kashmiri apples to Chennai’s Koyambedu Wholesale Market Complex (KWMC). Much before dawn, workers unload crates of seasonal produce, and retailers vie for the best prices at Asia’s biggest market place for perishable goods. For the last 15 years, Murugan*, a parking personnel at the flower market’s gate, has witnessed the coming and going of seasons, flowers, customers, and trucks. Most of all, he has seen the cityscape change with the addition of flyovers, bridges, cars, and metro construction.
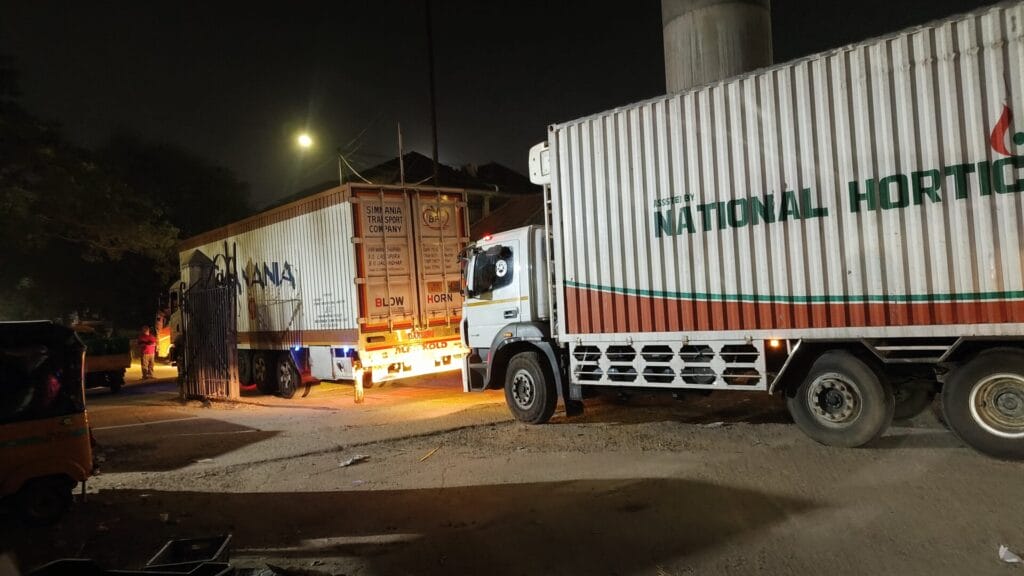
This December, a combination of mud from vehicles, metro work, and road dust sticks to Murugan’s skin after his 12-hour shift. Skin rashes are an everyday occurrence for him. “This time, the dust is bad due to road and sewage works. At least 2,000 trucks arrive daily at the flower market at 10 pm, while night buses leave from the Chennai Mofussil Bus Terminus,” he says, wiping his hand on the back of his neck to show the dust.
If one thinks of dust and smoke in Chennai, they must come to Koyambedu market, he declares.
A year-long study by the Indian Institute of Technology Madras (IIT-M) found high levels of PM 2.5 (fine particulate matter) in certain areas of the city, linked to winters, vehicular dust and lorries. In part one of our series on air pollution in Chennai, we explore how PM 2.5 levels affect people at this wholesale market.
But first, about the IIT-M project
The study is part of IIT-M’s Project Kaatru, which aims to provide a low-cost, mobile solution for capturing hyperlocal air pollution data. The air quality changes drastically every 100 metres, says Professor Raghunathan Rengaswamy, Dean (Global Engagement) and Faculty, Department of Chemical Engineering. This initiative aims to empower individuals and communities to make informed decisions about their environment.
The other team members include Sreejith C (postdoctoral researcher); project associates S Sumeer, VP Amrithalakshmi, Prashanth, Elango and Aishwarya Murugan; project interns NS Jayasurya and Jaisreeram; and MS students V Navneethakrishnan and Hemnath B.
Read more: Low-cost, mobile air quality monitors will empower citizens: Dr Raghunathan Rengaswamy, IIT Madras
Pollution at flower market
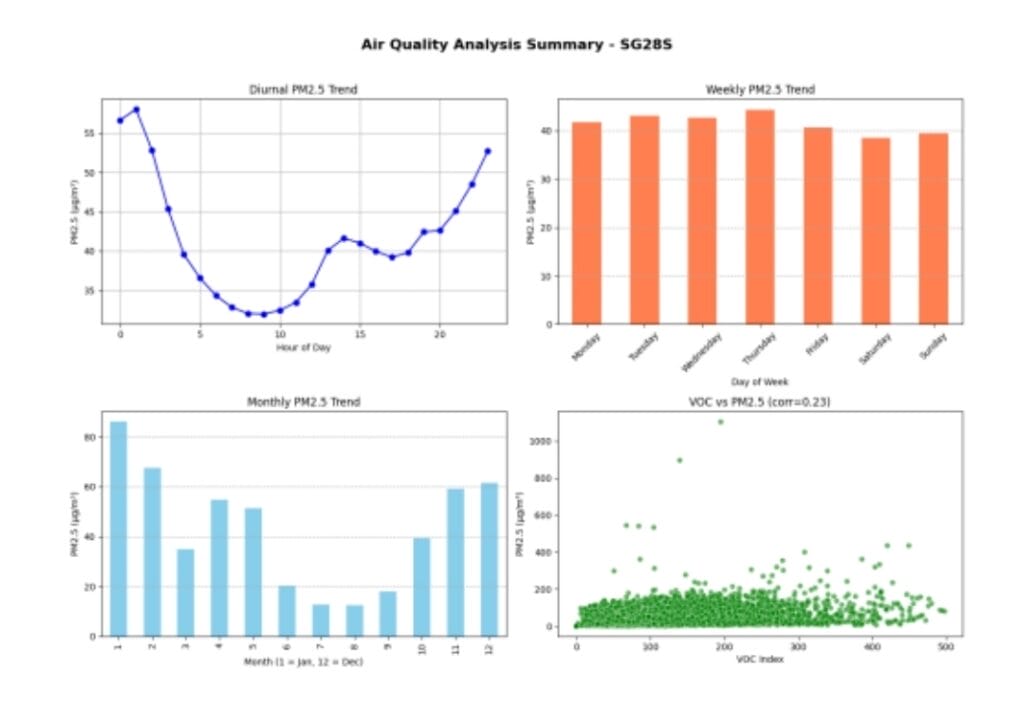
As part of the study, an SG28 low-cost IoT sensor (mobile air pollution monitoring device) was installed at the flower market, and found these pollution spikes at late-night and early-morning peaks (11 pm–2 am; 5–7 am) aligned with lorry arrivals, idling trucks, and unloading activities. Vehicular dust, road dust and fumes lead to spikes in pollution, say experts.
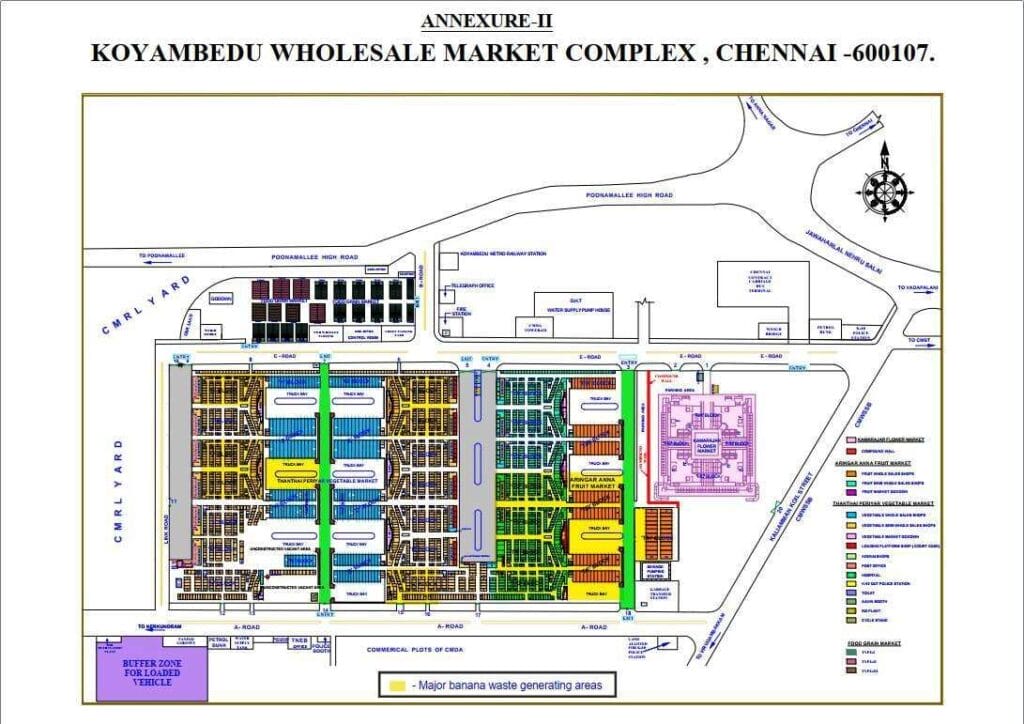
Bustle, trucks, smoke, stray animals and waste are almost synonymous with the Koyambedu complex for vendors. In 1996, this complex was started as part of the Chennai Metropolitan Development Authority’s (CMDA) first master plan, which aimed to decongest areas like Parrys Corner and Kothwal Chavadi. Spread across 295 acres, it is home to 3,194 shops — 1,956 vegetable shops, 472 flower stalls, 992 fruit shops, and 492 grain shops.
Vendors across the vegetable, fruit and flower markets reported the largest number of vehicles during nighttime, but most mentioned that smoke was there throughout the year. According to an official at the Market Management Committee (MMC), who preferred to remain anonymous, “around 14,000 vehicles come to all markets. There’s a 30% spike in numbers during peak seasons.”
Gearing up for Christmas, Pongal and Bhogi festivals, the market sees a spike in customers and produce, say vendors. And pollution is bound to follow, they add.
Spikes during winter, lorry arrivals at night
The IIT-M study noted winter spikes of PM 2.5 crossing 150–400 micrograms per cubic metre (μg/m) — deemed hazardous — due to reduced atmospheric mixing and higher market intensity. Particulate matter was also affected by humidity, diesel emissions, waste decomposition and temperature in an area.
According to the findings, the flower market entrance’s PM 2.5 levels were 123–137 μg/m at 10 pm to 12 pm for several days in November and January. On February 8th, for instance, it was 321.3 μg/m, flagging the hazardous nature of the air here.
This is reiterated by a recent study by the Centre for Science and Environment, which reveals that mega Indian cities such as Delhi, Mumbai, and Chennai have experienced worsening of PM2.5 levels in the winter of 2024-25. It found that January was the most polluted month for Chennai, with Chennai and Manali being the most polluted stations.
Examining this data, environmental health researcher and campaigner Vishvaja Sambath points out how vehicular pollution, the tearing of tyres, engine emissions, and buses at Chennai Mofussil Bus Terminus station contribute to pollution in the market area. “This is a time when vertical mixing decreases; the winter cycle pushes hot air upward, but at the ground, cold air traps pollutants, so they are more visible in winter,” she adds.
Informal workers vulnerable to air pollution
For informal workers, December or panni season brings hazy weather, fevers, coughing and other ailments. It was a persistent dust allergy that pushed Lakshmi*, a fruit seller, to undergo a nose surgery six years ago. “I came here in 1996, when the market was constructed, but only a few years ago, the dust worsened the allergy,” says the 48-year-old.
A recent Lancet report found that over 17.18 lakh deaths were attributable to anthropogenic air pollution (PM 2.5) in 2022 in India, an increase of 38% since 2010. The use of petrol for road transportation contributed to 2.6 lakh deaths, it added. Studies have shown how PM 2.5 can impair lung function.
Health concerns
Inside the Koyambedu complex, a clinic was set up over a year ago by the MMC, following demands from vendors. Here, around 35-40 patients come in daily during the winter season, points out Dr Praveen V, present at the emergency centre, which is open 24×7. “Vegetable pollen from layers of onion, waste in the market, lack of housing and an inconsistent sleep routine aggravates the health of workers here. Dew, rain, and pollution can add to this,” he says, noting that their health conditions cannot be directly linked to air pollution alone.
A former head of the flower market association, under conditions of anonymity, said that metro construction dust, stagnation of water, and breeding of mosquitoes have added to health concerns.
Some vendors pointed to the vegetable market being the most polluted, some point to construction while others said summer brought more health concerns due to heat and smoke. “Large vehicles plying and industrialisation are more to blame than the market’s infrastructure,” says Mani, a street vendor selling corn and sweet potatoes. He adds that the market had muddy roads during the early 2000s, which causes more dust than now. But he says air pollution needs more focus in this area.
Why do cities need hyperlocal data for air quality?
- In an attempt to track air quality, Chennai has eight Continuous Ambient Air Quality Monitoring Stations (CAAQMS), that function 24×7 throughout the year. However, as the IIT-M team and other experts point out, traditional methods like this offer accurate readings for 50 to 100 metres of an area but air changes every 100 metres as well.
- Experts emphasise a decentralised approach to collect hyperlocal granular data. “For instance, in Ennore, which has many red-category industries, we need this data to keep these factories compliant. Beyond monitoring, we need to take action, put this information out publicly, and impose fines on industries that violate these measures.” Vishvaja adds.
- “If there is a very high emission happening in a local area, then we won’t come to know about this [with traditional devices],” says the IIT-M team. The team adds that CAAQMS won’t aid in concluding as to why these are high PM 2.5 levels. But with their mobile sensors, they highlight limitations, lack of usable data, and need for government permission to install more stations with cameras.
Read more: Explained: How air pollution levels are monitored in Chennai and what the data implies
Vishvaja points out how government allocation for monitoring and the Tamil Nadu Pollution Control Board needs to be increased. “The staff vacancies need to be filled; only if there is adequate staff can we check beyond the computer monitoring.”
The IIT-M team highlights the need to improve the road conditions of roads to reduce dust, and the collection of granular data to tailor policies at a hyperlocal level. Experts point to the need to increase budget allocation for pollution control boards with special focus on staff and granular collection of data.
Recommendations from experts on road ahead in Koyambedu:
- Government-sanctioned studies with cameras to map exact nature of source of pollutants.
- As this market area sees high vehicular movement, shift from diesel and petrol-powered heavy vehicles to electric-powered ones.
- In CMBT areas, redistribute traffic or expand the area. Ensure that public and private buses plying in this area consistently check emissions and have updated pollution under control certificates.
- Expedite metro construction.
- Craft health policies that address informal workers in the market and their exposure to specific pollutants.
The second part of this series will examine how air pollution in Ambattur affects citizens.
*Names changed to protect identities
यह वातावरण प्रदूषण की समस्या मजदूरों के स्वास्थ्य को कैसे प्रभावित कर रही है, और क्या स्थानीय प्रशासन पर्याप्त कदम उठा रहा है? सादर प्रणाम Telkom University Jakarta
useful and umportant research study for the benefits of the Chennai people. Good research work. Big salutes to the entire team
This is very important and needed at the momemt. This research team should study other parts of the city and provide the solution to the government
Best wishes for the entire team, particularly to the Professor.