Mumbaikars may have briefly felt better as pollution levels dipped with the unseasonal showers last week. But it may not last long and that persistent cold and cough might just return as temperatures fluctuate and pollution levels rise again.
Mumbai, the most densely-populated city, and in the throes of infrastructure projects and other construction, has had worrying pollution levels in the past few months. Data now shows that Mumbai has recorded a 38% increase in the PM 2.5 and PM 10 levels over the past five years. The data was analysed by Climate Trends and Respirer Living Sciences, and presented in the report, Five years of the National Clean Air Programme.
In 2019, the central government launched the National Clean Air Programme to deal with unabated pollution and its severe impact on public health in 102 cities. The data was analysed from the Central Pollution Control Board’s network of Continuous Ambient Air Quality Monitoring Stations (CAAQMS) in 131 non-attainment cities.
With funds at disposal, authorities are putting measures in place to reduce pollution. However, even the best performing cities remain above permissible limits set by the World Health Organization. The ones with higher incidence of pollution are a serious concern for public health.
“While progress has been made, the report highlights that air pollution levels in most cities exceed national standards and international guidelines, emphasising the ongoing challenges in achieving globally recognized air quality benchmarks. The least polluted cities still surpass the World Health Organization’s safe limits, underscoring the need for more stringent regulatory frameworks. The findings highlight the positive strides made under the NCAP while emphasising the need for continued efforts to attain cleaner air across the nation,” states the report.
Mumbai pollution figures
The report says that Mumbai’s PM2.5 levels went up from 35.8 ug/m3 to 49.5 ug/m3 from 2019 to 2023. Similarly, the city’s PM10 levels increased by 36%, from 80.6 ug/m3 to 110.3 ug/m3.
The number of active monitors in Mumbai also went up from nine in 2019, with an uptime of just 21%, to 22 in 2023, with an uptime of 83%. The uptime for Mumbai’s PM10 monitors went up from 20% for nine active monitors in 2019 to 84% for 23 monitors.
Uptime refers to the period of time an air quality monitor is actively recording data. One way of calculating uptime is on the basis of number of days a monitor is actively recording data. So, if a monitor is recording data for 300 days, the annual uptime is 300/365 =82.19%.

Despite significant deterioration for both pollutants, a slight improvement in the levels was recorded compared to last year. It’s an improvement of 2.2% for PM2.5 and & 8% for PM10. “The levels for PM2.5 for all five years are in the ‘satisfactory’ category of the CPCB and those for PM10 moved from satisfactory to moderately polluted,” says the report.
Read more: Will the ban on open garbage burning reduce pollution in Mumbai?
Performance of other cities
Among all the 131 cities, Varanasi has performed the best with a substantial decrease of 72% in PM 2.5 levels and 69% reduction in PM 10 levels. Agra and Jodhpur are two other cities with maximum reduction of around 50%. All three cities have increased the number of monitors over a period of five years, indicating that increased monitoring enables citizens to gather accurate data.

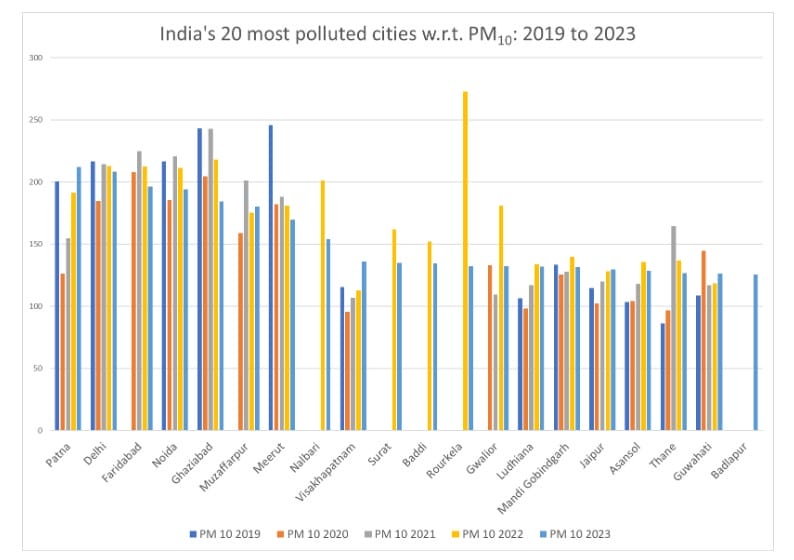
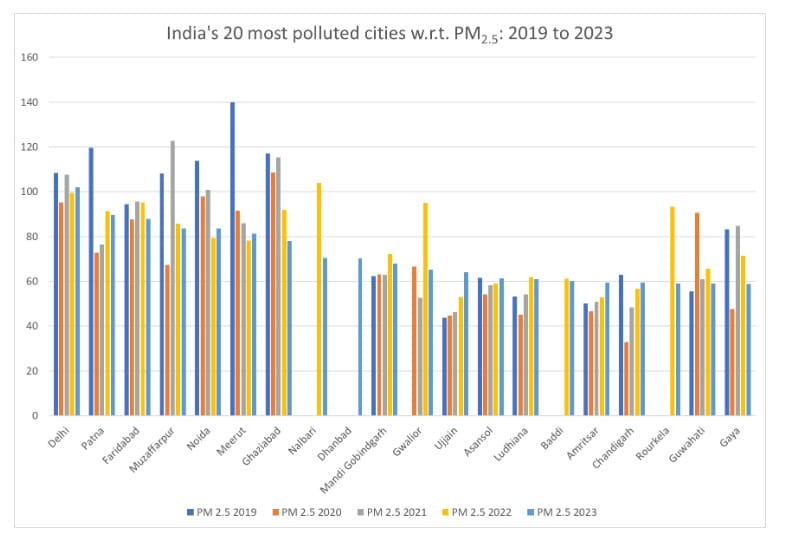
Of the most polluting cities Navi Mumbai, Mumbai along with Ujjain have recorded an increase of around 40% in the PM 2.5 and PM 10 levels. Thane too has significantly high levels of PM 10.
“Over the five years, Navi Mumbai’s PM2.5 went up from 38.8 ug/m3 to 56.9 ug/m3. Ujjain’s PM 2.5 increased from 43.7 ug/m3 to 64 ug/m3, and Mumbai’s levels went up from 35.8 ug/m3 to 49.5 ug/m3. The number of active monitors in Mumbai went up from nine in 2019, with an uptime of just 21%, to 22 in 2023, with an uptime of 83%. Navi Mumbai also saw an increase in active monitors and uptime, but Ujjain continued to have only one monitor with nearly 100% uptime,” the report said.
Funds to combat pollution
NCAP is a well-funded programme with a disbursal of over Rs 9649.99 crore from the central government.
“Urban local bodies are the implementing agencies for NCAP, and they are responsible for spending the funds disbursed to them for clean air action plans. These plans outline the work that the cities are required to undertake in the short, medium and long term. Of the total funds released to the cities, Rs 5835.03 crore, a little over 60% have been utilised by the urban local bodies. However, some cities have spent more than the others,” states the report.
Thane, which has high levels of PM 10, has spent around Rs 41 crore despite not receiving any funds. On the other hand, some cities like Nashik have not spent any funds.
Government measures for Mumbai’s rising pollution
There were a few days in October 2023 when Mumbai’s pollution levels plummeted below Delhi, which has the worst levels. This was serious, given Mumbai’s proximity to the sea. The Brihanmumbai Municipal Corporation and the state government introduced regulations and penalties for polluters. The civic body also banned open burning of garbage. They also washed the streets to clear the dust and introduced plans to install smog towers among other measures, which was later dropped.
A group of citizens also filed a public interest litigation in the Bombay High Court, urging the court to step in. The HC stayed transport of construction debris and directed the authorities to implement measures.
Despite all the measures that are being implemented, environmentalists, civic activists and most importantly, doctors emphasise that a lot more needs to be done on an urgent basis to prevent a larger health crisis.
| Useful resources |
| 1. https://www.researchgate.net/publication/343978867_Can_We_Vacuum_Our_Air_Pollution_Problem_Using_Smog_Towers 2. https://www.respirer.in/wp-content/uploads/2024/01/FINAL-Five-Years-of-NCAP.pdf 3. https://www.respirer.in/wp-content/uploads/2023/11/REVISED-NCAP-Tracker-Diwali-AQ-Report-with-Updated-Data-Nov-14-2023-1.pdf 4. https://prana.cpcb.gov.in/#/home |
