In the first of this two-part series, we discussed the quality of the building plans sanction dataset on the BBMP website. The data is potentially crucial in informing, visualising and guiding the built-form in the city. Thus, the imperative to streamline and quality-check the data collation exercise cannot be over emphasised.
In the second part, we illustrate the insights from this data. The publicly available data was used to understand the direction and typology of built growth expansion across time at the city, zonal and ward scale. These insights, we argue, are critical inputs for planning and managing the city.
The 38,733 data points on the building plans, sanctioned between 2010 and 2022, were analysed along their spatial and non-spatial attributes to understand the built-growth expansion and densification in Bengaluru.
What this data reveals about the direction of built growth
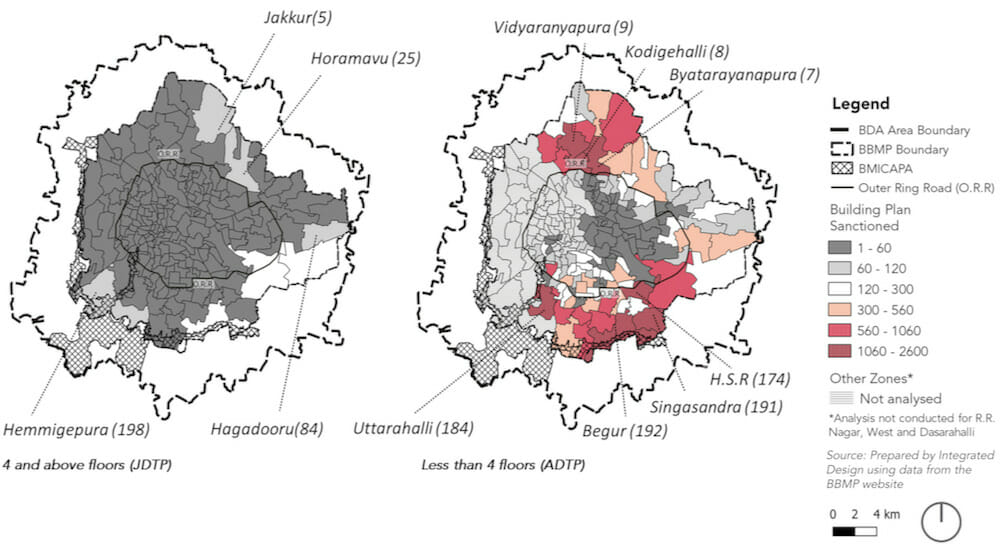
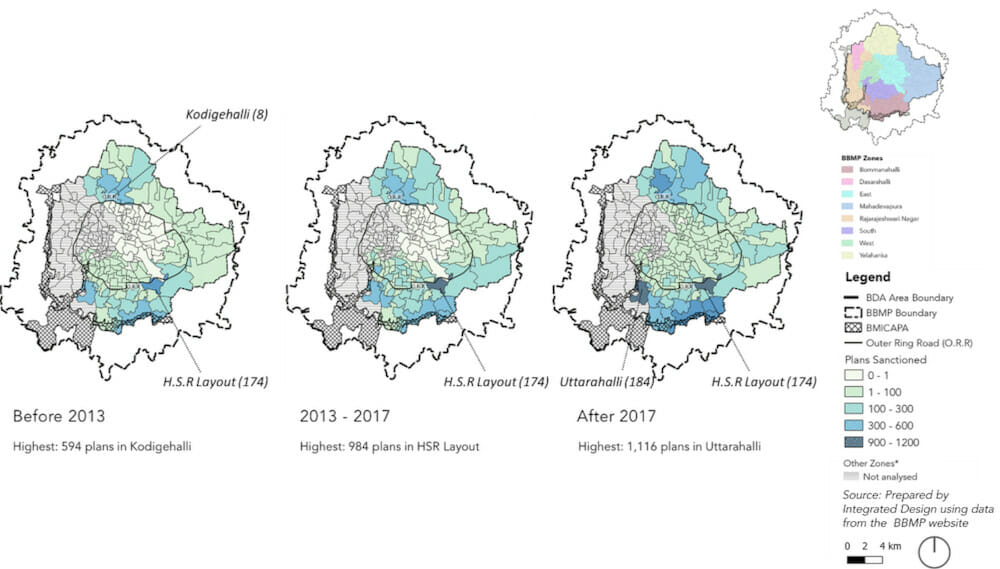
The satellite image of Bengaluru was overlaid with the sanctioned building plans dataset to triangulate the observed growth (Figure 1). The city is expanding largely outside the Outer Ring Road (ORR) in the arc extending from the north, through the East- South-East and the South (areas marked within the blue boundary in Figure 1).
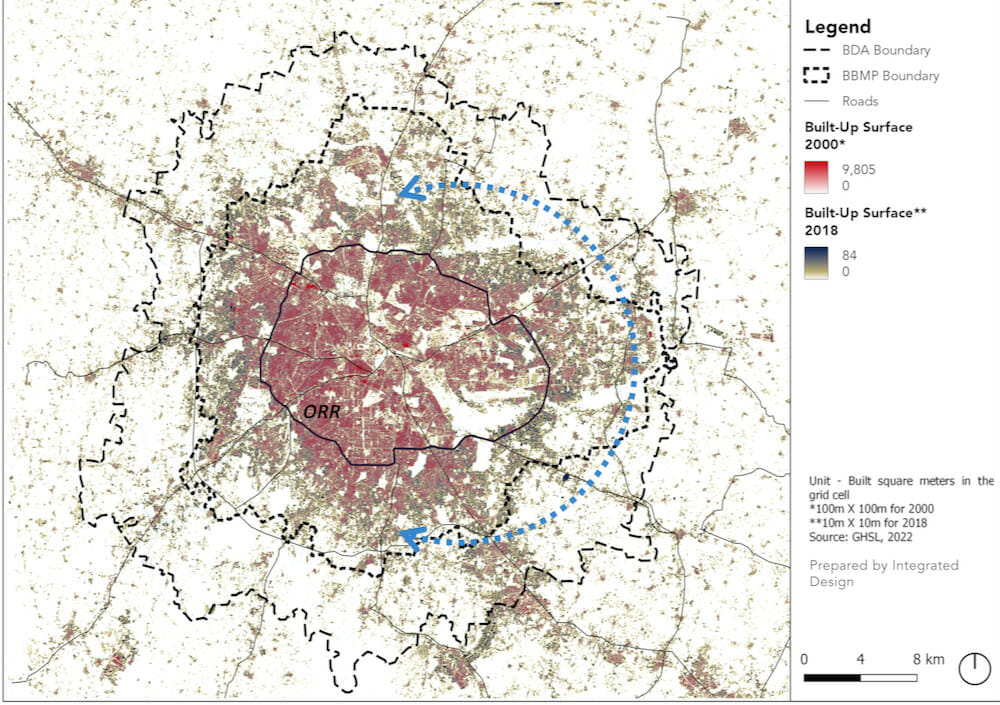
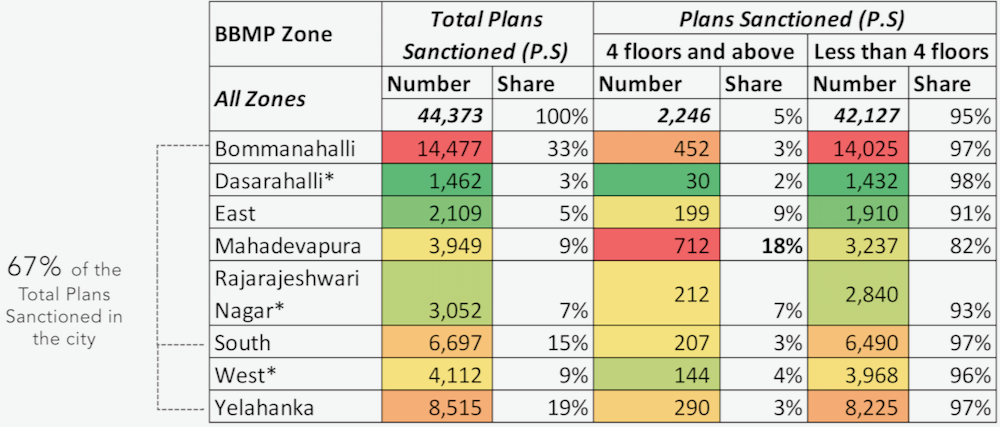
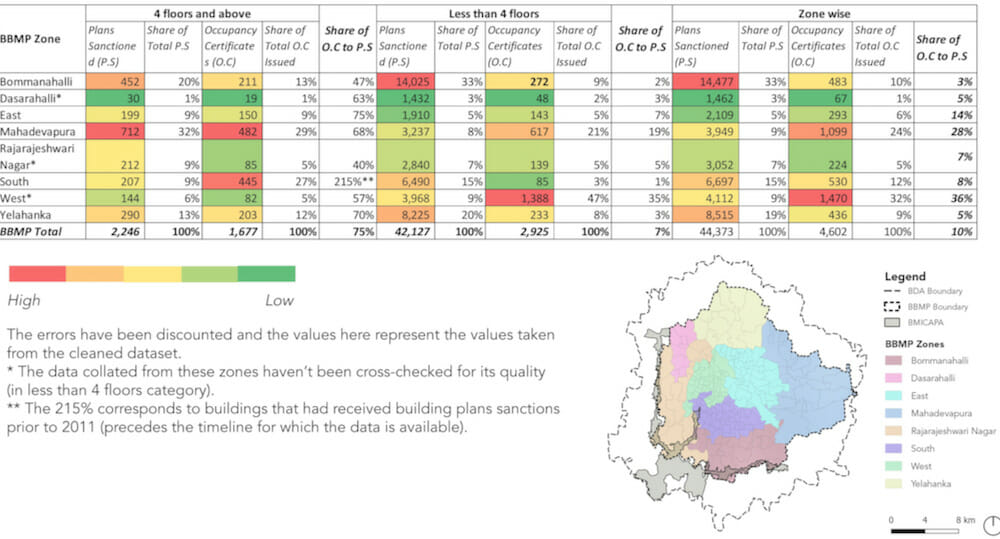
These are mainly the zones of Yelahanka, South and Bommanahalli, closely followed by Mahadevapura and East zones. The former accounts for over 65% of the total building plans sanctioned in the below four floors category. Overall, in the city, only 5% of the total building sanctioned are four floors and above, with Mahadevapura in the lead where approximately 18% of the sanctioned plans are in the high-rise category (Tables in Figure 2 & 3)
A disaggregated analysis of plans sanctioned at the ward level pointed to the type of built growth sanctioned at this scale. In the wards of HSR Layout, Uttarahalli and Begur, the less than four floors category is dominant while in Bellandur, Jakkur, and Hagadooru wards high-rise development is relatively higher.
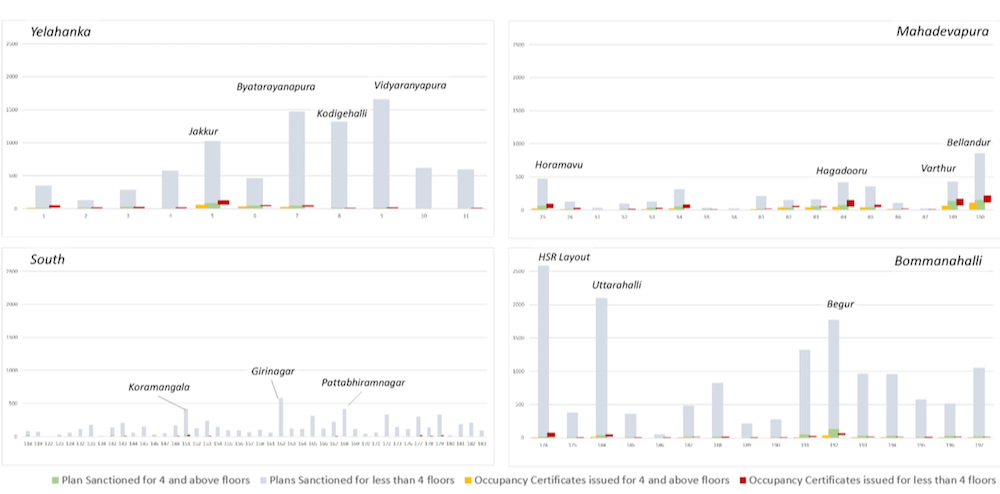
Spatially, these wards, Jakkur, Horamavu, Vidranyapura, Kodigehalli, Byatarayanapura and HSR Layout, are abutting the Outer Ring Road, in the second ring, in close proximity to the technology work centres.
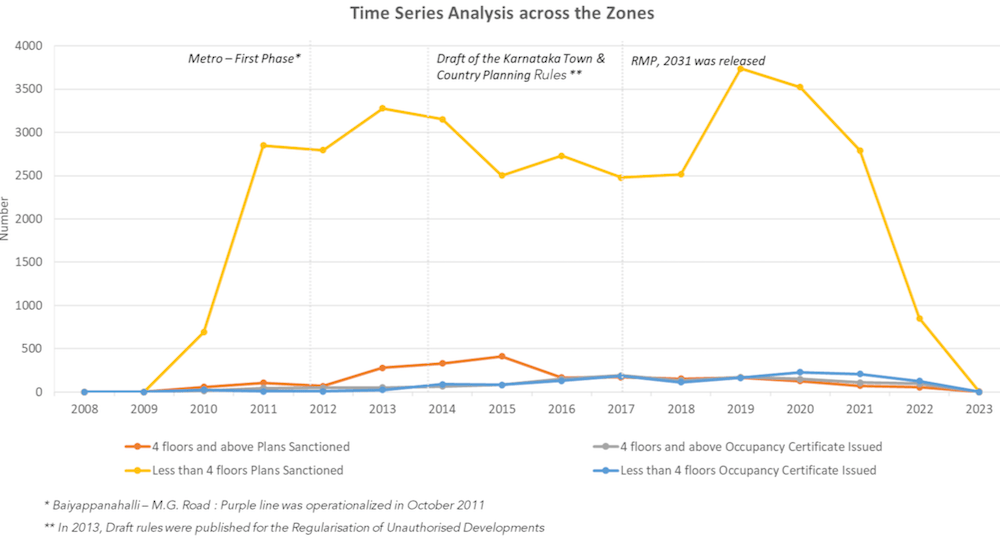
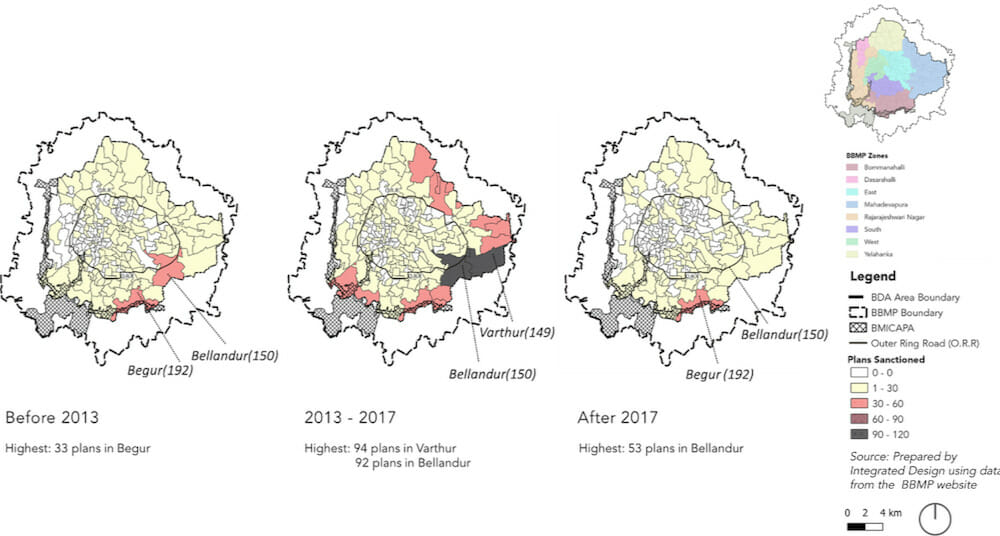
A time series analysis at the city scale (Figure 6) speaks to the years which witnessed a spike in plan sanctions i.e., between 2013 and 2019. The former can be attributed, among other factors, to the Draft rules of Karnataka Town and Country Planning that allowed for regularisation of building plan deviations. Approximately, 8 lakh illegal constructions and more than six lakh violators of by-laws sought regularisation. The latter is attributed to the now withdrawn draft notification of the RMP 2031.
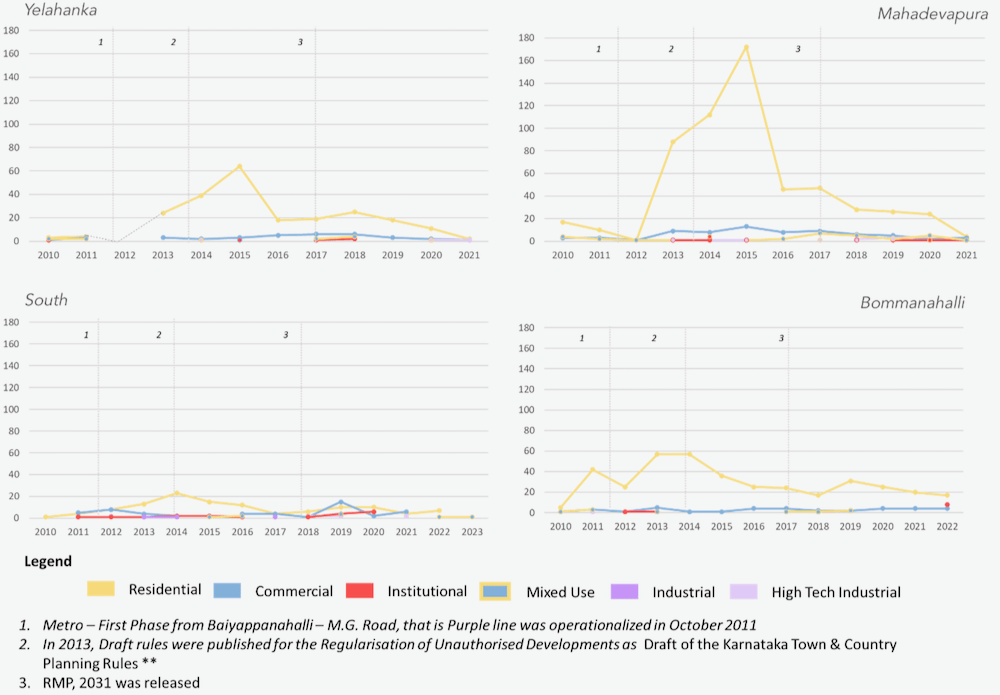
Further, a temporal mapping of the ward-wise buildings plans sanctioned in the two categories in Yelahanka, Bommanahalli, South and Mahadevapura zones, illustrates consistent sanctions in the four and above floors segment in the North-East-Southeast and the South. In contrast, in the below four floors, sanctions are largely in the North and South sections.
Overall, most plan sanctions, irrespective of the category, are being sought in the peripheral zones where infrastructure provisioning is slower than in the rest of the city. This constitutes a crucial insight for planners and authorities preparing these services and systems, especially concerning public transport, water, and sanitation.
Nature of built-growth expansion
Most of the plans sanctioned are for residential use across all the BBMP zones. However, the South, East, and West zones have a substantial segment of commercial buildings, largely in the four and above floors category. A further disaggregated analysis at the ward scale shows that these are concentrated in wards Shantala Nagar (111) in East Zone, Marapanahalli (44) and Gandhinagar (94) in West Zone, Uttarahalli (184), Arakere (193), and Gottigere (194) in Bommanahalli Zone, Koramangala (151), Vishweshrapuram (143), Jayanagar (153), Pattabhirama Nagar (168) and Sunkenahalli (142) in South Zone. Kuvempunagar ward (11) in Yelahanka Zone has all four and above floors as commercial establishments. Notably, all these wards are near the Central Business District (CBD) of the city.
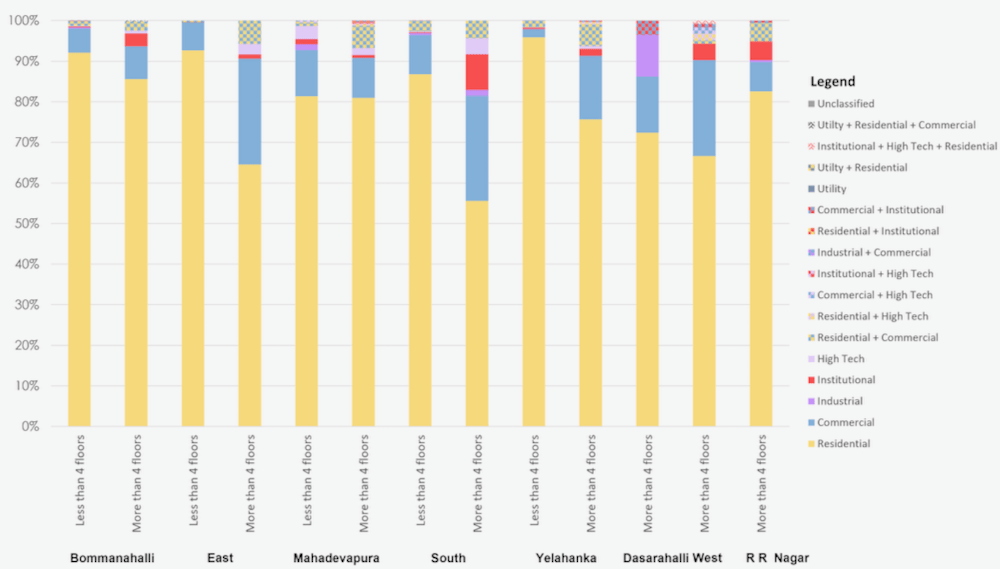
However, the South, East, and West zones have a substantial segment of Commercial buildings, largely in the four and above floors category. These are concentrated in wards Shantala Nagar (111) in East Zone, Marapanahalli (44) and Gandhinagar (94) in West Zone, Uttarahalli (184), Arakere (193), and Gottigere (194) in Bommanahalli Zone, Koramangala (151), Vishweshrapuram (143), Jayanagar (153), Pattabhirama Nagar (168) and Sunkenahalli (142) in South Zone. Kuvempunagar (ward 11, Yelahanka Zone) has all four and above floors as commercial establishments. Notably, all these wards are near the Central Business District (CBD) of the city.
Read more: Making sense of Bengaluru’s messy urban development data
Once the building plans are sanctioned, the BBMP is expected to monitor the construction process as shown in Figure 11.
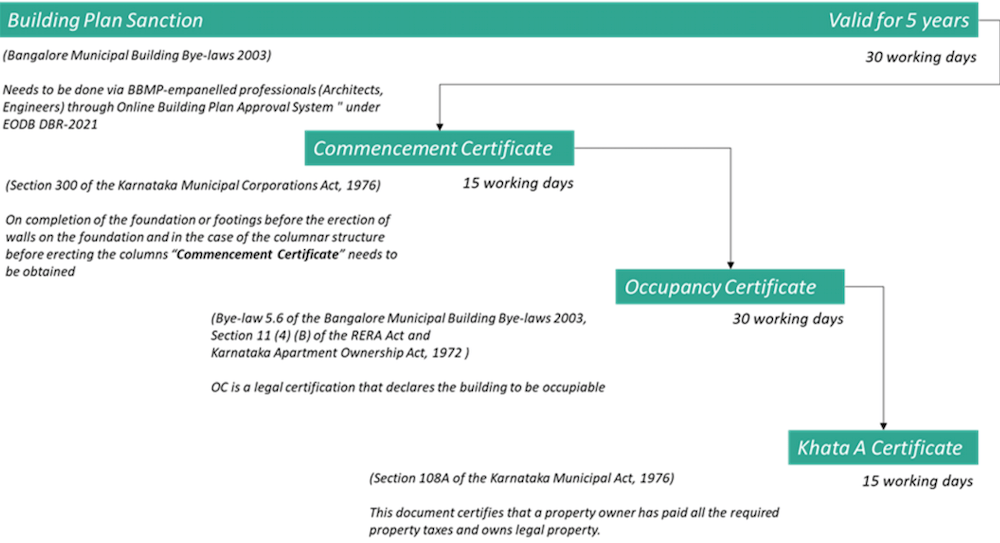
In the above process, the Occupancy Certificate (OC) is a critical step and a crucial data set. The OC is issued once the building construction is complete as per the sanctioned plan indicating the readiness of the building for occupancy*. Basic services such as water, sanitation and electricity connections are provided only after the OC is issued. Yet, conversations with multiple stakeholders revealed that building owners get basic service connections without an OC**.
There are other reasons too for why an OC is not sought. Deviation from the sanctioned building plan is the major reason. Further, a large gap between the plan sanctioned and OC is observed for buildings that are less than four floors. This gap implies that built fabric expansion occurring on the ground- Bommanahalli, South and Yelahanka – is substantially higher than what is sanctioned. This has huge implications for the provisioning of basic services, attendant infrastructure planning as well as quality of life.
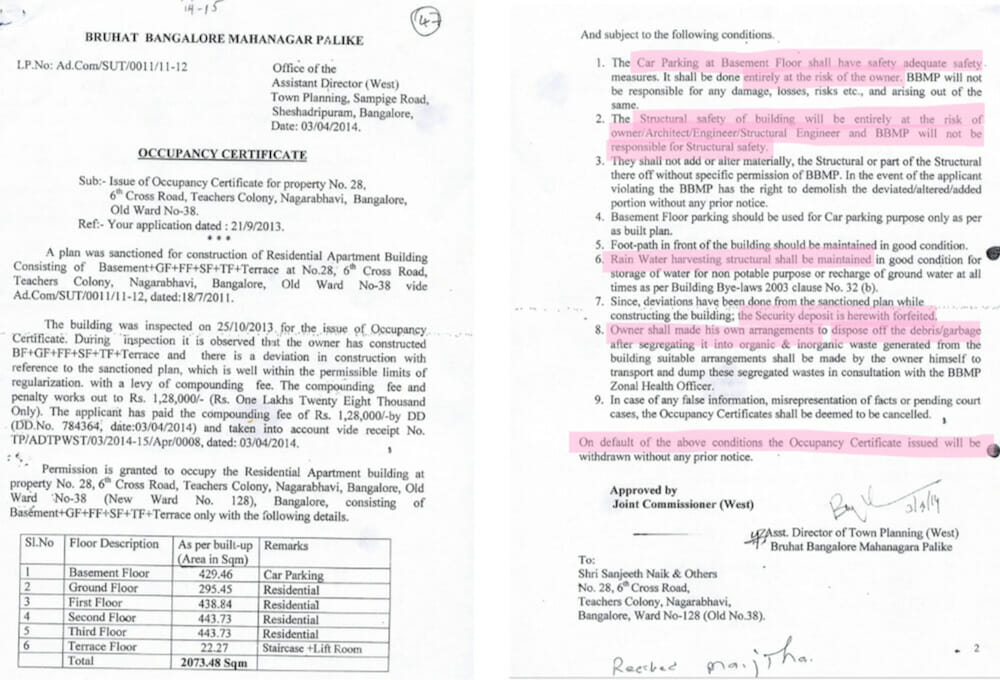
While the Building Bye Laws 2003, allow for a 5% deviation from the plan sanctioned, a larger violation invites a penalty (Building Bye Law 5.7). These violations are regularised through a penalty charge and forfeiture of the security deposit. Notably, the structural safety of the modified/altered building post the penalty is the responsibility of the owner (Figure 12).
This provision contradicts the purpose of an OC as well as the larger public good goal of the BBMP. Furthermore, the conditions for obtaining an OC have been consistently diluted.
Way forward
Although the publicly available data is incomplete, we analysed it to illustrate a use-case, emphasising the relevance of this data to decision makers, urban planners, and policy makers in comprehending and provisioning the city’s growth.
At the minimum, the exercise allows visualisation of Bengaluru’s built form trajectory. Making public the data on the building plans and layouts sanctioned by the BDA will provide a complete picture of the city’s growth. As the administrators are gearing for revising the city’s Master Plan using drones, the spatial attributes of this data can be powerful inputs to managing and steering the city’s growth.
*Post the building plan sanction, the construction is mandated to be completed within five years. The work shall not be continued after five years without obtaining prior permission from the Authority. Such continuation shall be permitted if the construction or reconstruction is carried out according to the licenced plan and if the Authority is satisfied that at least 75% of the permitted floor area of the building is completed before the expiry of five years. If not, the work can be commenced/continued after a fresh licence is obtained from the Authority (Building Bye-laws, 2003).
**Occupancy Certificate is required for residential/multi dwellings/apartments with five dwelling units & above and commercial buildings within 300 sqm of total area. BWSSB did not give connections to apartments that didn’t have an Occupancy Certificate (OC). With BAF’s (Bangalore Apartments’ Federation) intervention in 2019, BWSSB started giving connections to such apartments too, but these apartments have to pay 50% above their monthly water bill. For new electricity connections, no OC is required for both residential and commercial buildings.
[The authors would like to acknowledge Vyakhya Srivastava for assisting and contributing to the research work]