There are over 200 cities in the world that have a metro system. London’s Metro is the oldest, operating since 1863. Shanghai Metro’s network with nearly 750km is the world’s largest today. It also has the highest annual ridership of 2.83 billion trips (in 2020).
India’s growth post-liberalisation ushered in faster economic progress. Metropolitan cities being the biggest job creators began attracting migrants and have grown fast. Higher incomes have led to unsustainable levels of motorization because most cities have narrow streets. Bus movement has become slow in heavy traffic and hence is losing efficiency, particularly over long commute distances. Indian cities have thus begun building metro systems to provide better public transport despite the very high costs.
Kolkata already had a metro system since 1984. India’s first modern metro opened in Delhi in 2002. Delhi metro has expanded very fast and is currently the largest metro system in India. India now has 15 operational metro systems with several more under construction or in planning stages.
So, it has been two decades since Indian cities began building and operating metro systems. It is thus a good time now to take stock and analyse their performances.
Let’s look at data from stats and figures for systems that have completed a phase or a major part of it and were operational for a year or more as of 2020 (Note: The figures referred to are from 2019-20, the last year before the pandemic since for the past two years, Covid has seriously dented the performance of all Metro Rail Transport systems worldwide due to pandemic restrictions).
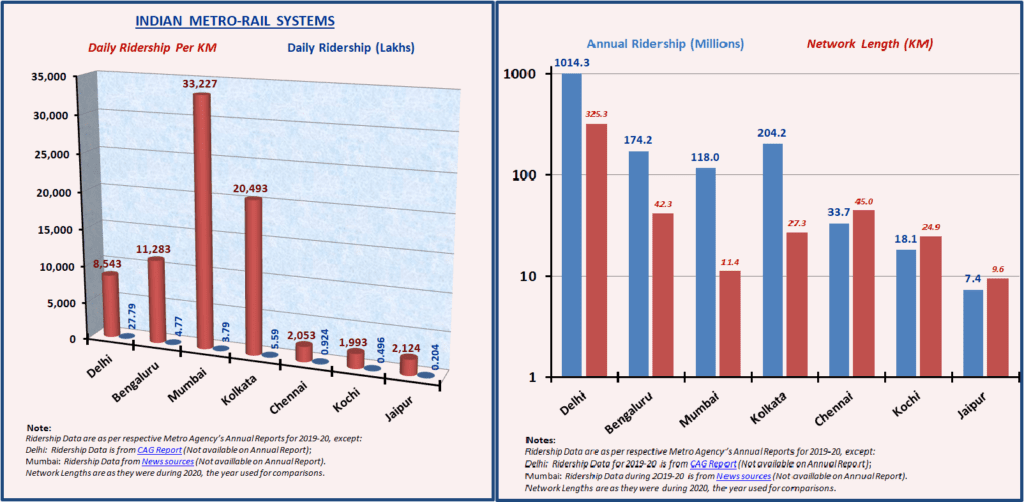
Mumbai, Kolkata, Bengaluru metros top in ridership per km, but none close to forecast numbers!
While Delhi Metro’s annual ridership is the highest among Indian cities, crossing a billion, it is also the one with the maximum length and coverage. However Kolkata, Mumbai and Bengaluru do much better in terms of per kilometre ridership.
Kolkata, Mumbai and Bengaluru’s ridership per kilometre numbers are well comparable to many global cities.
Read more: Chennai Metro in figures: How does it compare with Mumbai or Delhi Metro?
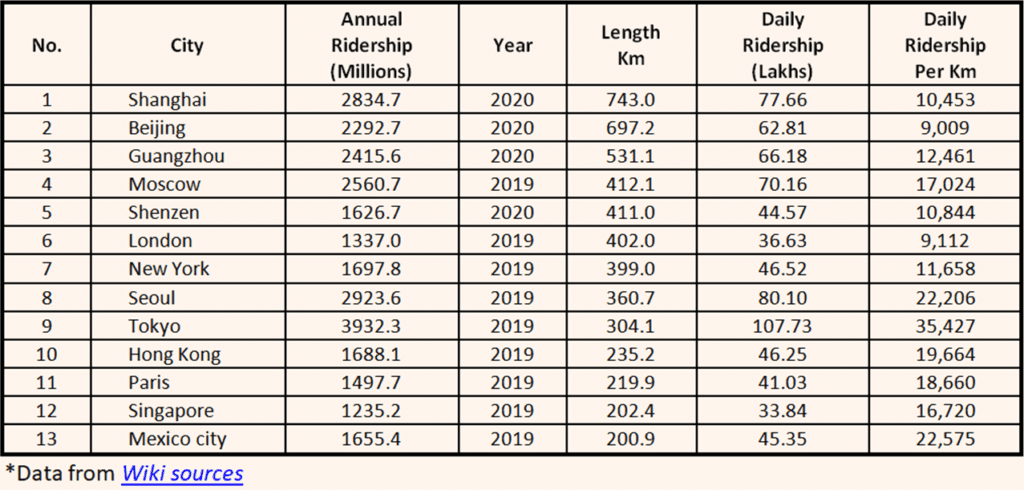
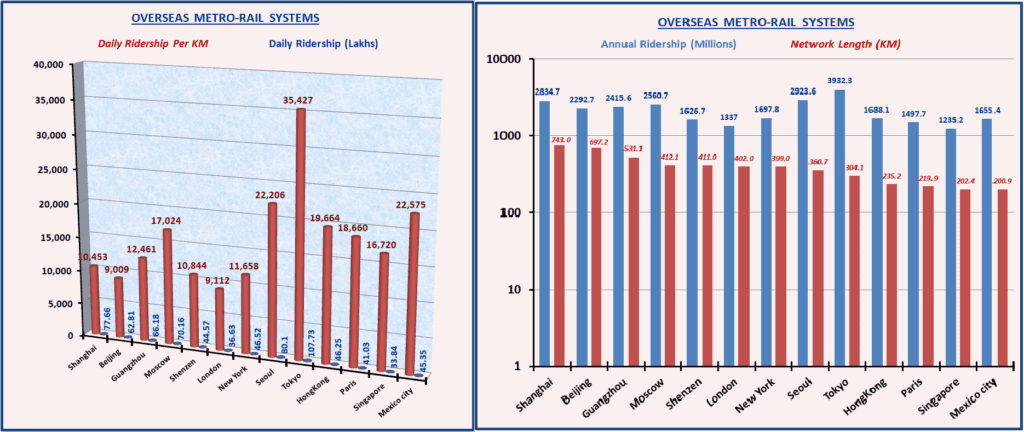
Check the ridership data for some large overseas systems.
Ridership Data (Overseas Metros):
Rather than total ridership, a comparison of average ridership per km per day is a better parameter since it shows the utilisation of the system more accurately for the high investments made. A scrutiny of the established overseas systems indicates that all have well over one billion per year.
- Only five out of the twenty Indian and Overseas systems have over 20,000 per km per day (Mumbai, Kolkata, Seoul, Tokyo and Mexico City).
- Four have between 15,000 and 20,000.
- Another five are between 10,000 and 15,000.
- Three are between 5,000 and 10,000.
- The remaining three are below 5,000 (all in India).
Mumbai Metro has the highest ridership per km in India and its system is just a small 11.4km solitary east-west line in the city that connects both its trunk suburban rail lines besides passing through the CBDs of Andheri and also intersecting the busy Western Express highway. However, it still only makes an operational profit and is yet to clear its massive debts. Mumbai metro is currently under massive expansion.
Delhi Metro actually had good ridership per km (14,570 in 2016-17) but has slipped back by over 40% (8,543 in 2019-20) after fare increases in 2017-18. Another issue could be that some of the new routes and extensions were unviable, particularly the longer suburban extensions. A recent CAG report had the following observations:
- “Out of the 13 corridors proposed for Phase-III, DMRC recommended two financially unviable corridors with negative Financial Internal Rate of Return”
- “In four corridors, the Financial Internal Rate of Return was enhanced considering inflated Fare Box Revenue to meet the benchmark of eight per cent.”
A comparison between the forecast ridership (as per DPRs*) against actual ridership after completion of phase proves none were close to forecast.
The average ridership achieved is thus 28.09% of forecast ridership, which is very poor. Those shaded on the table are below the average of 28.09%. Only Delhi, Bangalore and Mumbai fared better than average in the opening year.
Read more: The cost of the delay in Mumbai Metro Project
Metros running at loss
Here are the financials of Indian metro systems from their Annual Reports for 2019-20:
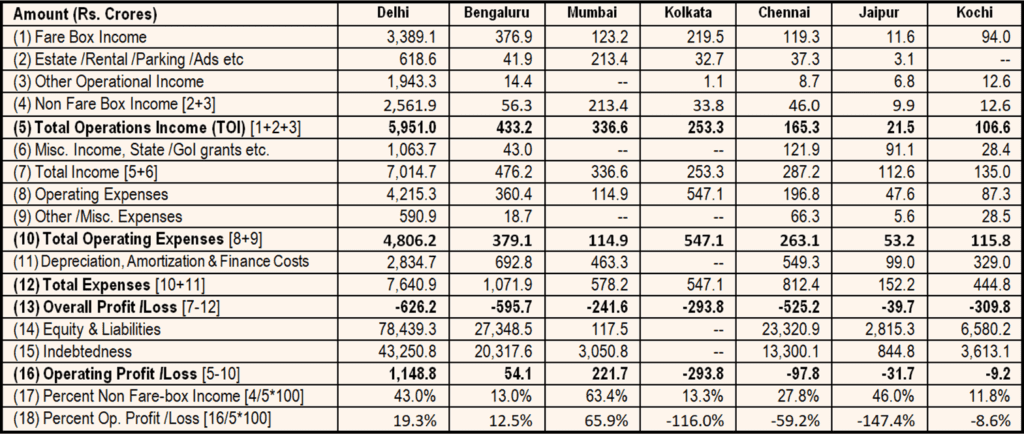
As can be seen, all metros have reported overall losses! Only Delhi, Bengaluru and Mumbai made operational profits.
Delhi Metro has a huge 43% share under non-fare-box revenues. However, the contribution from estate, rental etc. is small at just 10.4%. The rest (32.6%) is mostly from external projects and consultancy. This is likely to keep reducing as it has in the previous years (it reduced from 2,363.9 in 2017-18 to 2,014.1 in 2018-19 to 1,941.0 crores in 2019-20). The declining trend is because other states are becoming less reliant on DMRC for project management as they gain experience building, operating and managing on their own.
India’s efforts to capture land values have not been successful. Hyderabad metro which recently completed its phase-1 has also not been able to exploit and capture much value from the huge parcels of land given to it by the state government as part of the PPP agreement.
In sharp contrast, Hong Kong and Tokyo easily make profits without even relying on any estate development since their ridership is very high. Their ridership is very high for one or more of these reasons: difficult city terrain, high cost of fuel, high cost of vehicle ownership, long commuting distances, lack of big city motorways, costly tolls etc that are natural barriers for use of private transport. Hong Kong and Singapore have estate development that contributes handsomely to their non-fare-box revenues.
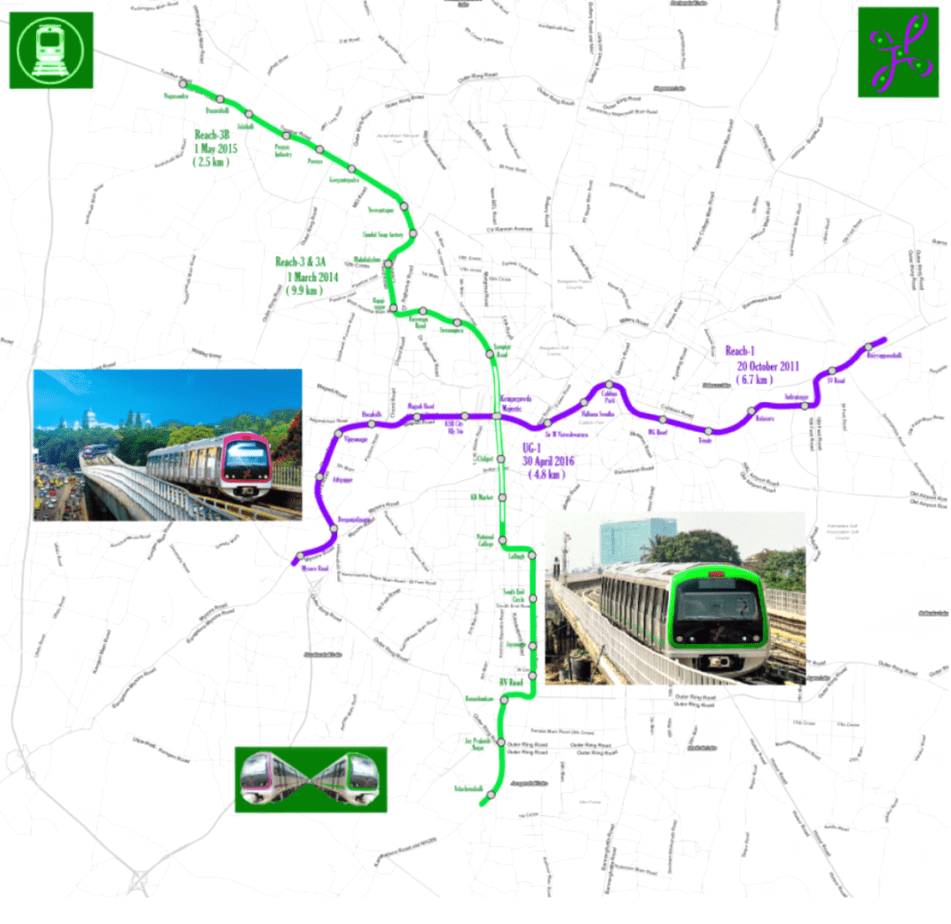
How is Bengaluru’s Namma Metro doing?
It has been over four years since the completion of Namma Metro’s phase-1. So, how is it performing?
BMRCL’s operating profit of 54.1 crores is a consolation but overall losses are on the high side. The bulk of Namma metro’s losses was due to finance costs and depreciation/amortisation.
Ridership per km is reasonably good, better than Delhi which has a much bigger network. Namma metro’s ridership needs to go up substantially if losses have to be cut down. Fare-box (i.e., ticket revenues) will be the key source of revenue accounting for a major portion of revenues (probably over 70-80%).
Non-Fare-box revenues are poor, in part due to BBMP’s ban on advertising on metro piers, portals and other such metro structures, but they need to go up to the maximum extent possible.
Getting Namma Metro on the road to good ridership and profitability
It seems clear that Namma Metro must rely mostly on farebox revenues and increase ridership substantially since capturing land value is going to be very difficult, even if land is made available for estate development. However, land is a scarce commodity in Bengaluru, particularly free government land for Namma Metro’s estate exploitation.
Another lesson is to research and plan extensions /additions very carefully, taking full consideration of the possibility of poor ridership.
Expansion /extension with huge scope of a hundred or more kilometres in one go in future phases is also to be avoided. Extensions/expansions are to be done after very detailed studies and simulations before routes are selected since lines with poor ridership can become a huge financial burden in later years.
While it is true that some lines will always lag behind others on ridership on almost all metro systems, all-out efforts need to be made to improve ridership on all lines.
It remains to be seen how other lines that will be opened soon would fare, particularly since work-from-home is now more or less an established business practice, besides COVID-induced reduction in commutes.
Also read:
- Proposal for a cheaper, efficient Metro line on Inner Ring Road
- How commute can be easy, safe during Metro work on ORR
- Gurgaon Rapid Metro: A public project for private gain
- Why Pune Metro promises need to be taken with a pinch of salt
- Murky Metro: CAG auditors point out irregularities in the way Jaipur Metro was launched


Excellent article with a lot of pertinent data. The painstaking research done by the author is evident. Wish to get in touch if the author can spare some time.
Sure sir!