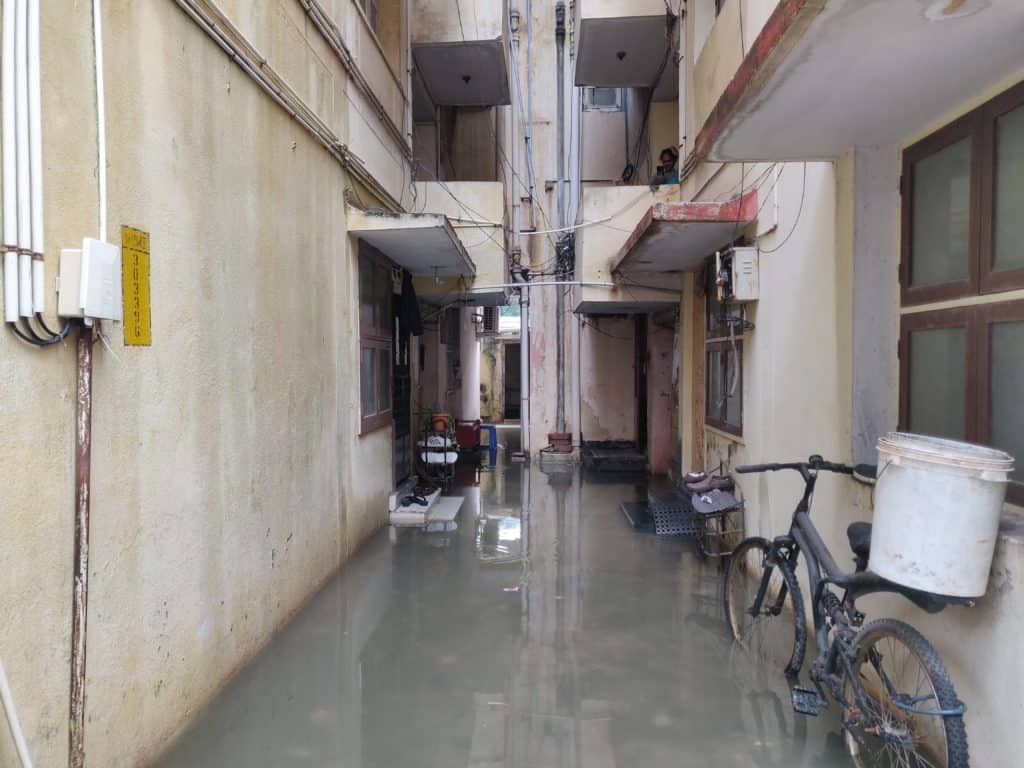
With intense spells of rain over the past month, there has been widespread flooding in Chennai. Areas such as T. Nagar, Guduvanchery and K K Nagar are among the many localities that experienced extreme waterlogging. Residents raised their concerns and requests to the civic body on social media by posting photos of water-stagnation and the damage caused by it.
Care Earth Trust, a city-based environmental organisation, saw here a need for better information at the ground-level for proper flood mitigation measures. And this information needed to be sourced from citizens themselves. Seeing as many in the city were taking to social media, Stephen Jayaseelan, the GIS Cell Lead at Care Earth Trust, started compiling the information posted by the residents. Soon the idea of creating a GIS map to plot streets in Chennai that saw flooding during the rains evolved.
Citizen Matters spoke to Stephen to understand the methodology behind the exercise and possible use for the data collected.
Tell us a bit about how the entire exercise came about. What was the vision behind it?
The reason this idea came about was that we realised we did not have a spatial understanding of the flooding. We may see news items on TV about the flooding but the spatial data could be useful to come up with a mitigation plan for Chennai. It can help us understand where the waterlogging levels are high. This kind of analysis is possible with this map.
What was the population for the data survey and how did you reach out to them? Tell us a bit about the entire methodology.
When the rain began we saw people make posts on social media about flooding across Chennai. We wanted to get more information beyond what was shared in these posts. So we created a Google form where we gathered details on date, time, location and water levels. We then plotted these data points on a map. It is a crowdsourced initiative done online.
Read more: Monsoon is here; is your area among those listed ‘vulnerable’ by GCC?
Is the data gathering still open? Can residents add to it now, and how? How comprehensive is the data as it stands now?
We are still in the data gathering process. We have received many responses from the southern and western parts of the city. We are trying to get more responses from the northern parts. We will be using this data along with reports we come across on social media to make a comprehensive map.
We are collecting data even in the aftermath of the flooding to compare information on flooding and the status of the same areas a few days after the rain. This will help us understand how long it took for the water to drain.
If you would like to log your response, visit: https://forms.gle/QKyG1QyAniKu6bQK7
From the data observed so far, are there any broad trends or insight or indicative factors that you spot? Any key takeaways that you would like to comment on?
It is too soon to determine any trends as the exercise is still underway and we hope to get more data points. But what I have seen so far is that there are many areas where the flooding has drained naturally. People have also logged reports that while there was flooding across Chennai, there was help from the Corporation in draining the water.
Read more: Chennai rains: The real reasons why urban floods are a never-ending problem in city
Have there been similar exercises carried out in the past? If yes, what were the findings?
Such an exercise has not been carried out by us before. We are gathering this much information for the first time after an internal brainstorming session with the team.
What is your expectation of the utility of these maps? How do you think they can be used best to mitigate the problem of flooding in Chennai? Do you plan to engage with the government?
Using the location and flood level data this map will help in flood mitigation. The flood map is being created using GIS, which provides information on elevation and incline. This will be triangulated with the flooding data to help ascertain what the drains and channels are that the water could be directed to. The information on the map must be used along with field visits to make informed decisions on flood mitigation.

Large underground multipurpose tunnel network used for light vehicle traffic can be a remedy to divert extreme flood water during flood and cleaned up for light traffic later.
Mud and silt on kerbs needs to be removed to prevent silting og storm water drains and water logging. Rain water should flow without impediment through the channels built for such a precise purpose
lovely crowd sourcing initiative. had a few waterlogged street pictures from Pallikarnai, which I deleted once they drained. best wishes.
Storm water drain is not constructed properly, water flow gets reversed, depth is not proper, desilting not done periodically, connection not established for storm water
Make every representative of politics and bureaucracy accountable. Impose strict fines and punishments.
Too much concretization is main issue of rainwater stagnation in streets of Chennai during rain. Every household in Chennai increases the inclination of their houses by using too much concrete on driveways. The result is loss of free soil; rainwater cannot seep into soil resulting in serious urban flooding. Citizens should understand this issue and use nature based solutions (using concrete gravel chips, sand or permeable grass pavers in and around their houses/apartments/driveways) to alleviate this problem. The idea of using permeable surfaces to help rainwater seepage could be made mandatory in academic institutions, religious places, public schools and public libraries. This would help in ground water recharge and prevent urban flooding. Besides, rainwater harvesting is very crucial too.