For birdwatchers, naturalists or concerned citizens curious to know more about the wildlife in their neighbourhood lakes, parks, and gardens, a new tool offers an exciting opportunity. Mapping Your Neighbourhood Avifauna or MYNA, a data exploration tool, allows users to visualise birdlife in green spaces around their neighbourhoods.
MYNA is a data exploration tool created by the State of India’s Birds team. The State of India’s Birds (SOIB) is a report that assesses the status of over 900 bird species in the country, using citizen science data.
The data comes from hobby birdwatchers or citizen scientists, who record their observations of bird species, numbers, location, time and date using a global platform called eBird. This information allows researchers to analyse the distribution and population of bird species around the world.
13 government and private research and conservation organisations across the country used this data to create the SOIB report in 2020 and, recently, in 2023. The citizen science data stored on eBird is available for the public, but this massive dataset requires some knowledge of statistical analysis.
The need for a local, easy tool
“Birdwatchers have been contributing to the eBird database for a decade now and there are some standard views provided by eBird through which one can crunch this data,” explains Praveen J, Scientist at the Education and Public Engagement team at Nature Conservation Foundation, one of the partner organisations of State of India’s Birds. “The existing data summaries include a list of bird species reported for India, for any Indian state, for a district, or even for a single eBird hotspot.” says Praveen.
“However, there was also a need from several citizen science groups to have these data summaries at much finer granularities, or with different boundaries that they may want to define. For example, there was no tool where one could create a checklist of the birds of a Panchayat, which was quite important as well, particularly to update the Panchayat biodiversity register. There was also nothing available as data summaries for Protected Areas or forest divisions, where the boundaries are quite well known,” says Praveen.
This growing demand was the genesis of MYNA, a simple yet formal tool, which can be used by everyone.
Using MYNA
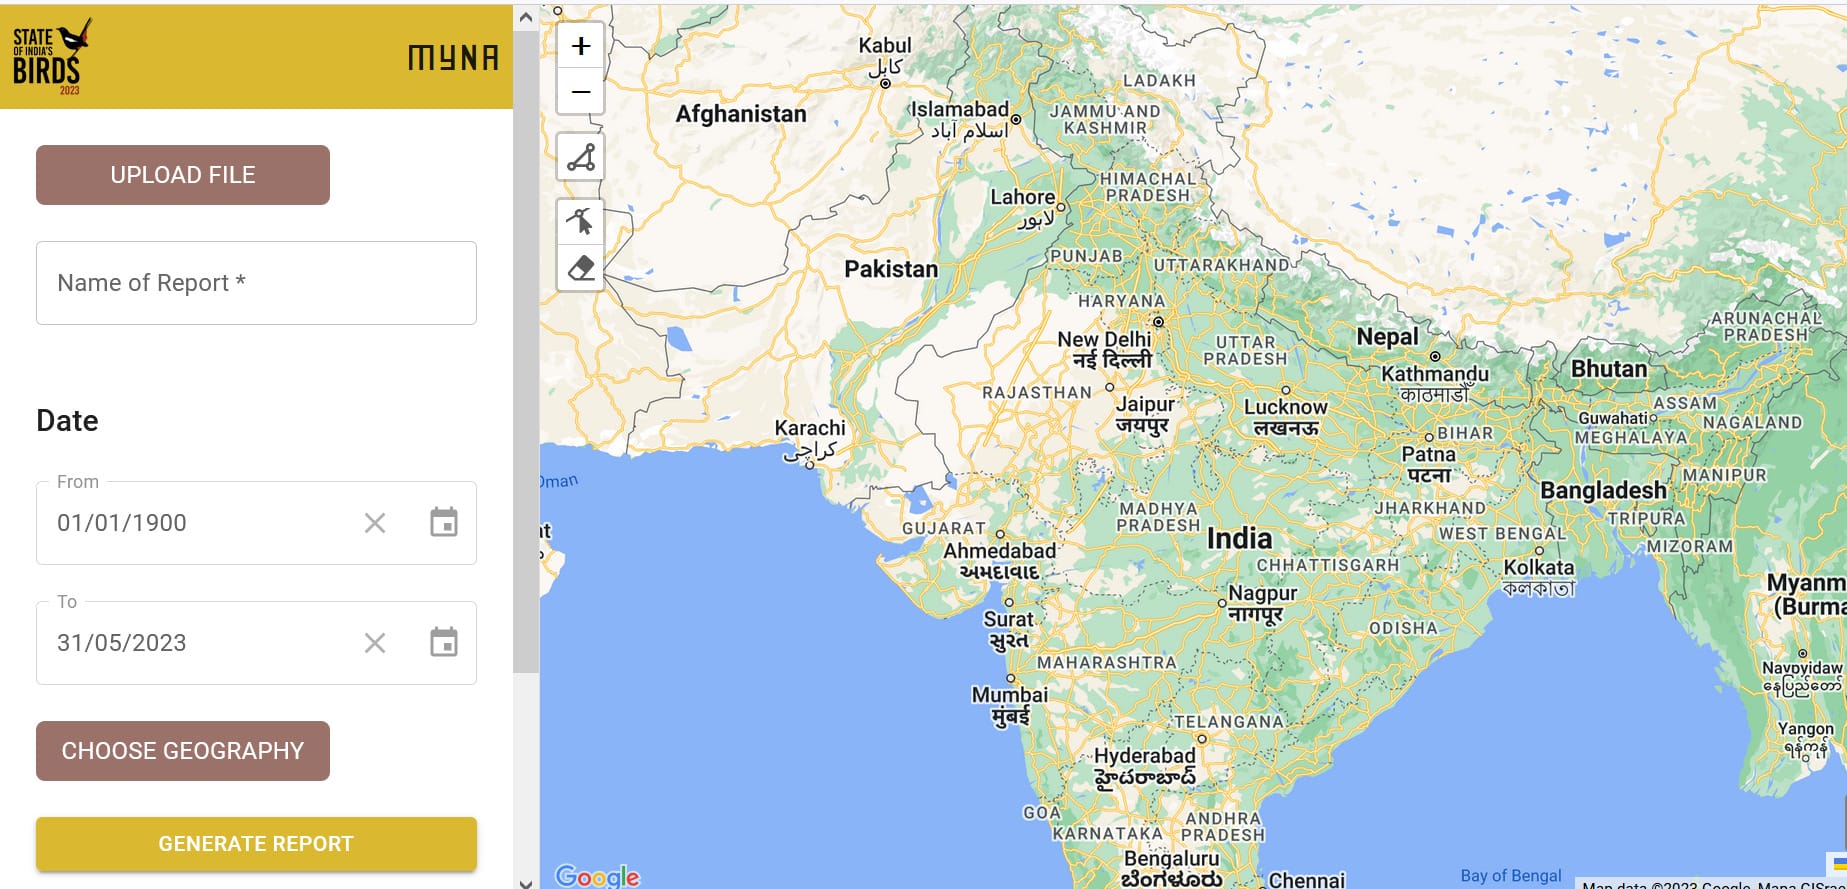
How can MYNA be used? MYNA is an online tool that works best on laptops or computers. You can access it here.
The first step is to give your report a name.
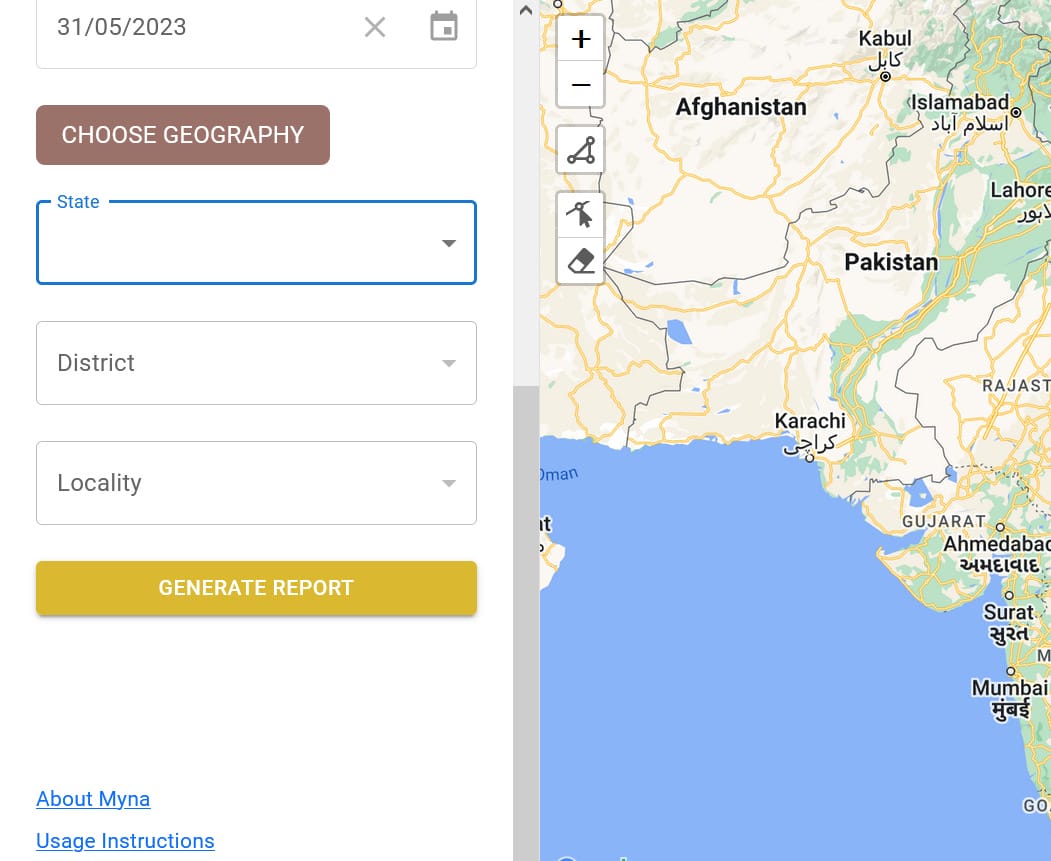
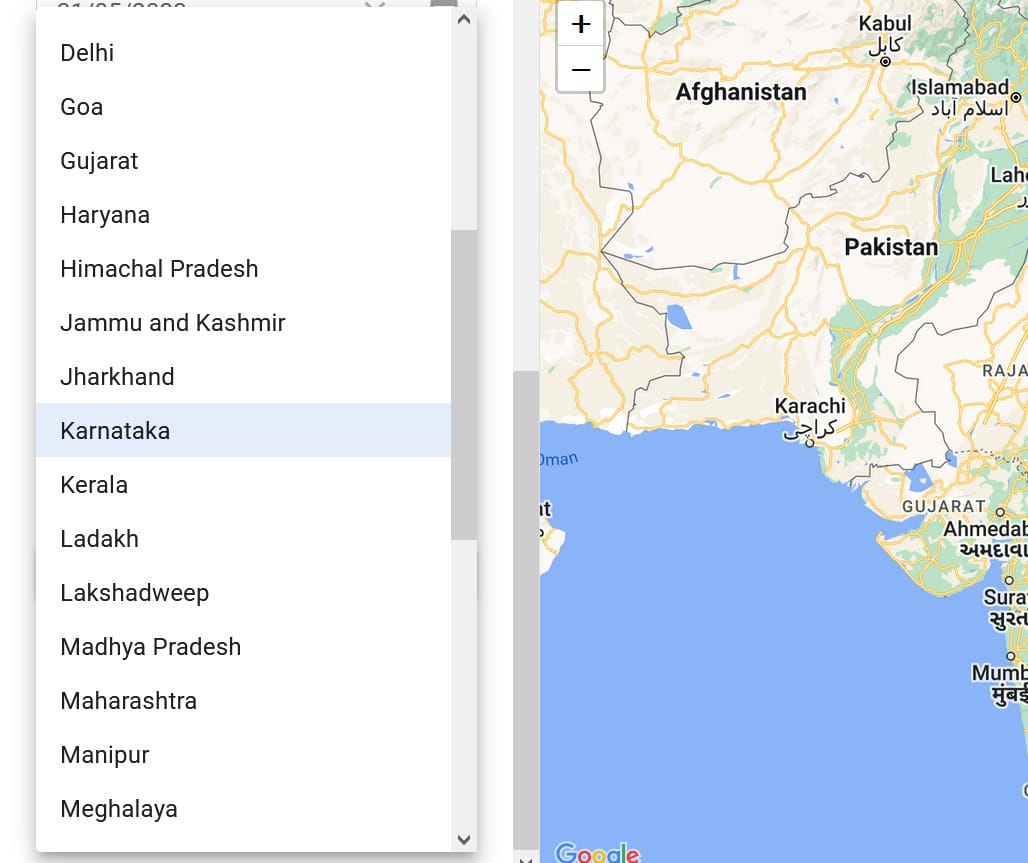
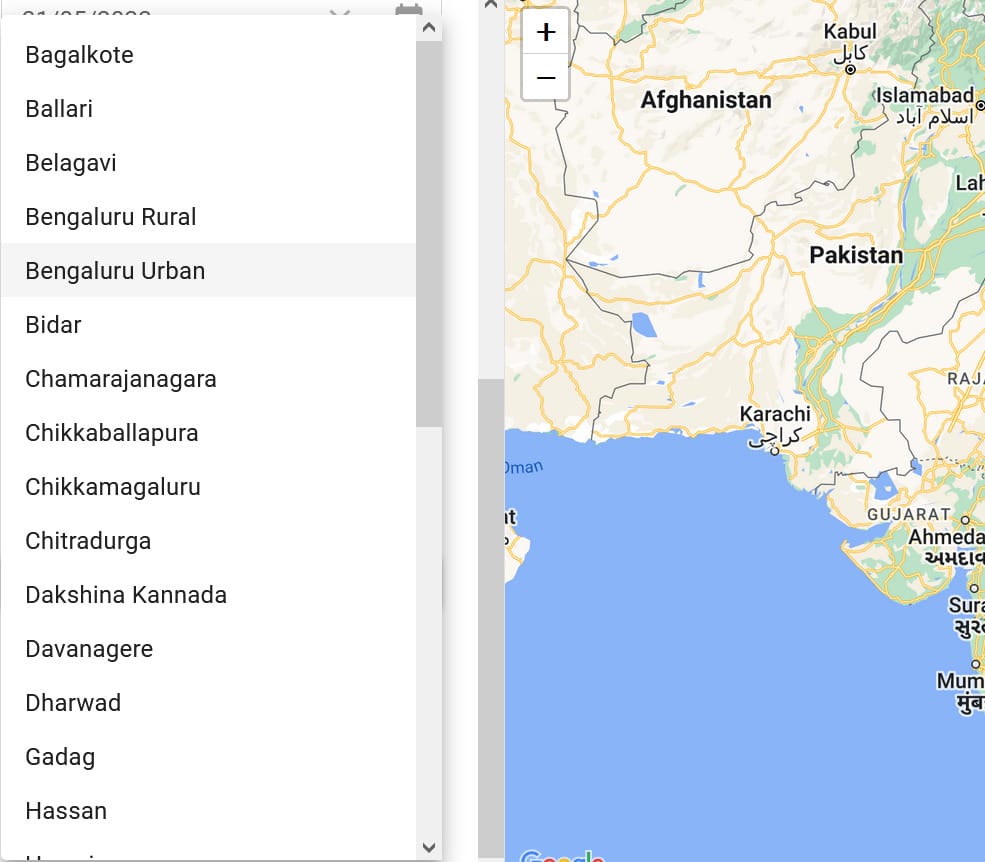
Next, enter the location data, that is the area for which you want to generate a bird report. You can upload a GIS or map file in .kml format, GeoJson and ShapeFile. Notably, .kml formats are very common and easily generated on Google maps. Projects that seek environmental clearance, such as big townships, will often provide a .kml of their proposed project site in environmental impact assessment reports.
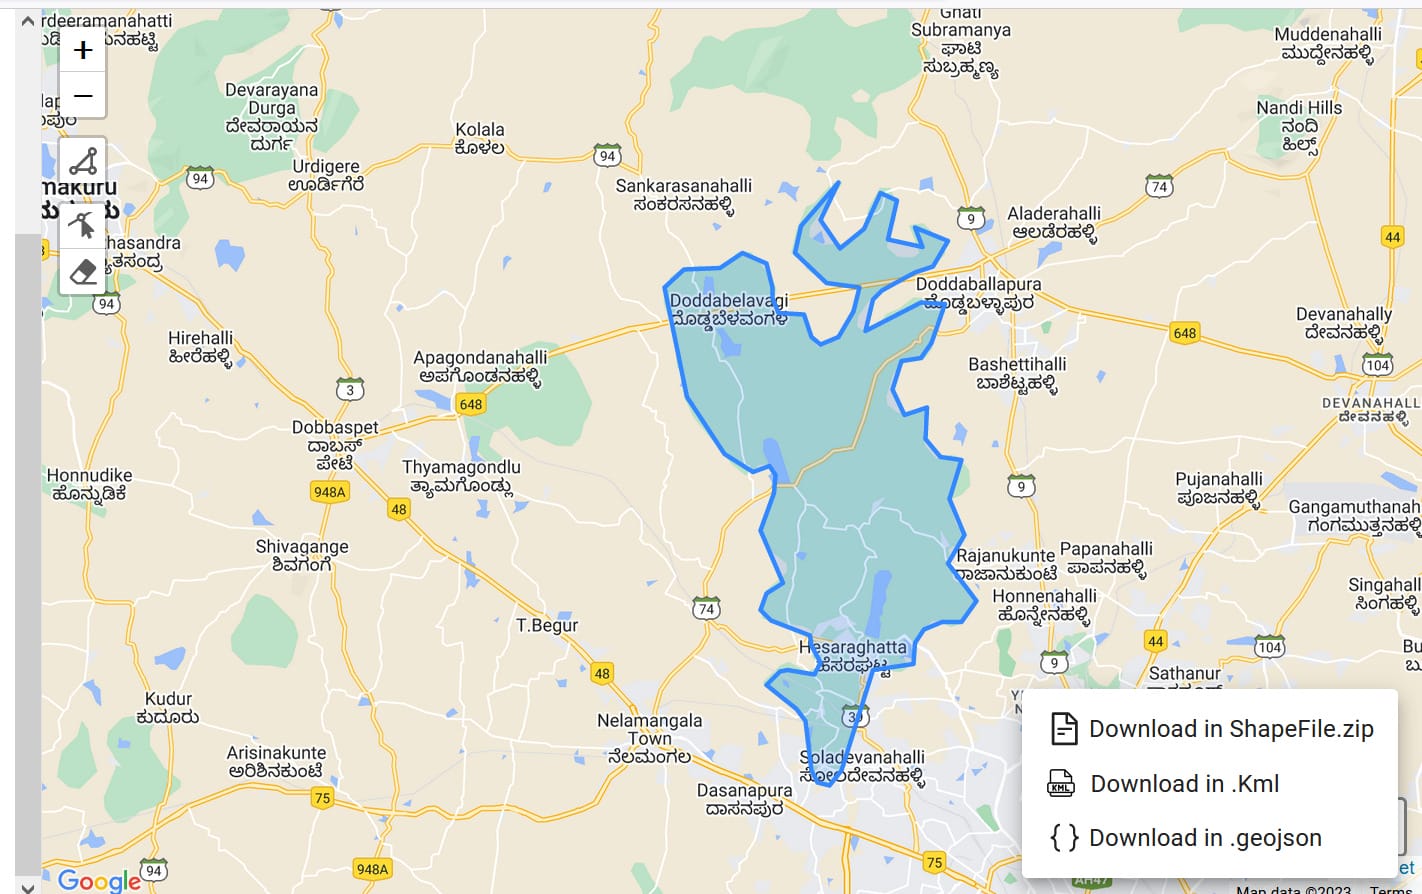
You can also simply draw a polygon around a locality that you want to assess. For example, below, I have drawn a polygon around a large area comprising the Hesaraghatta grassland, Avalahalli state forest and several small lakes north of the city.
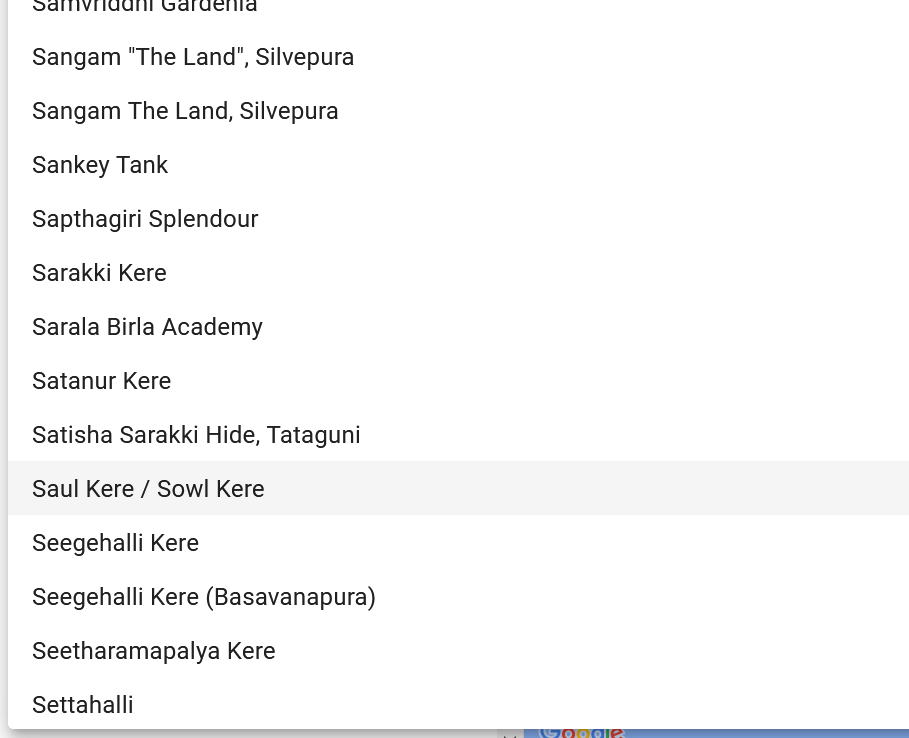
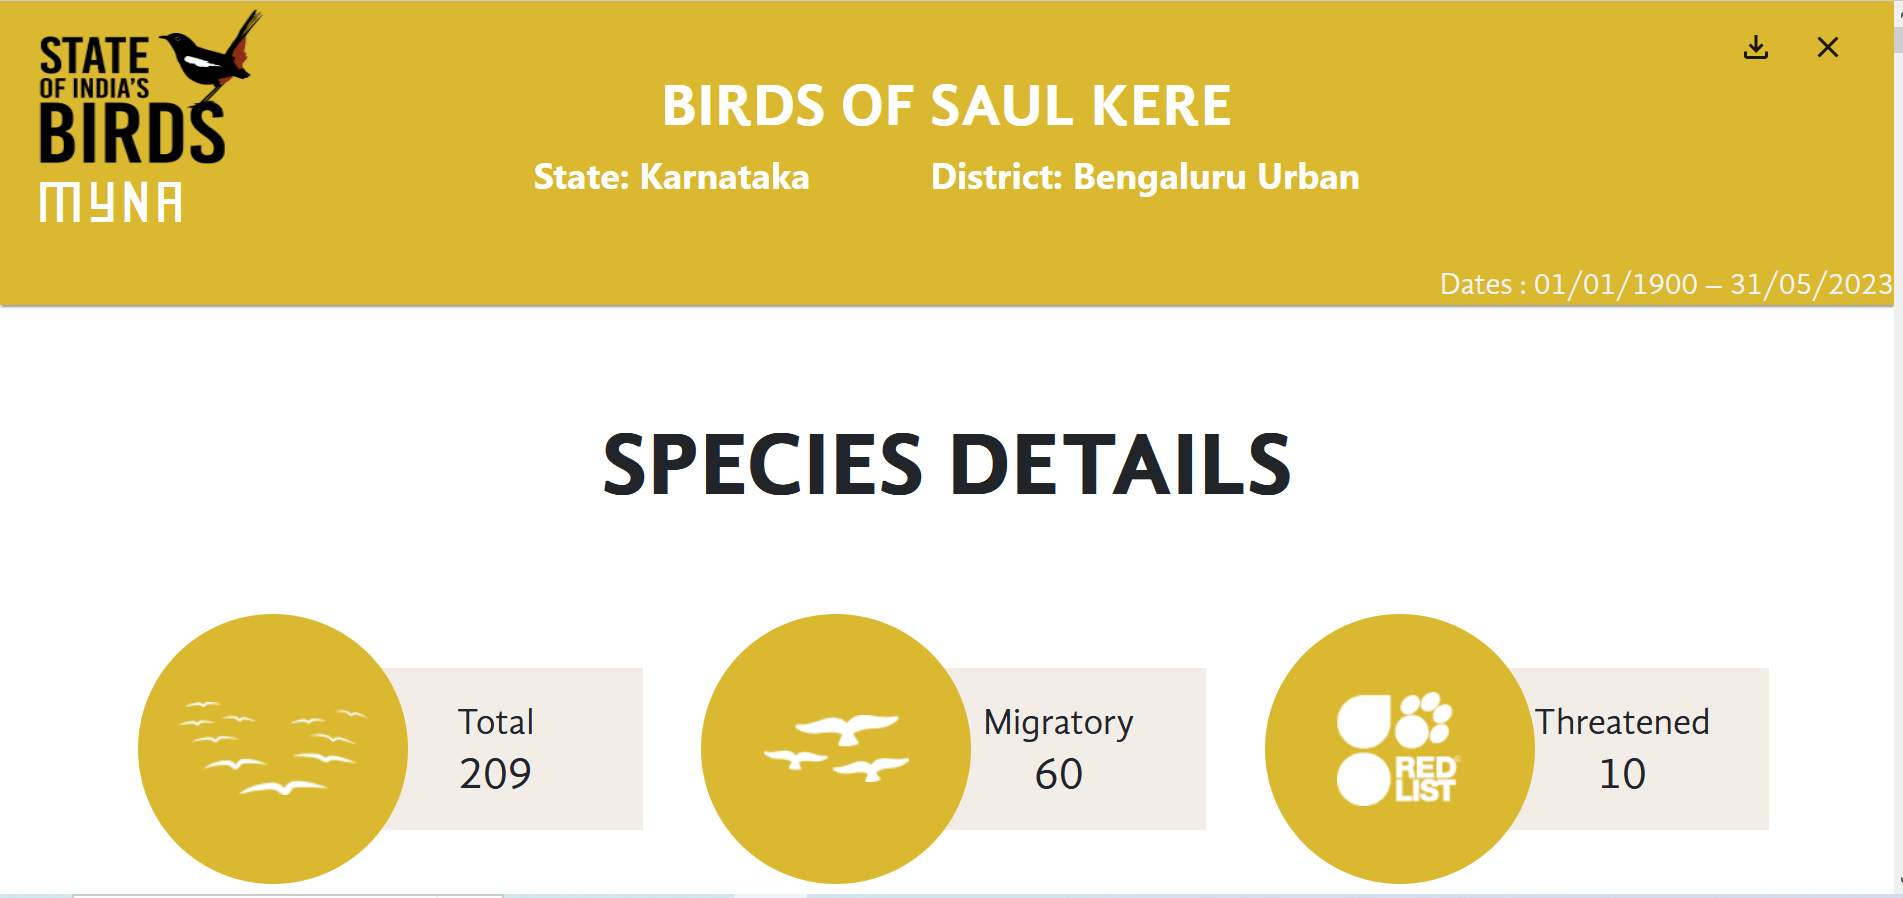
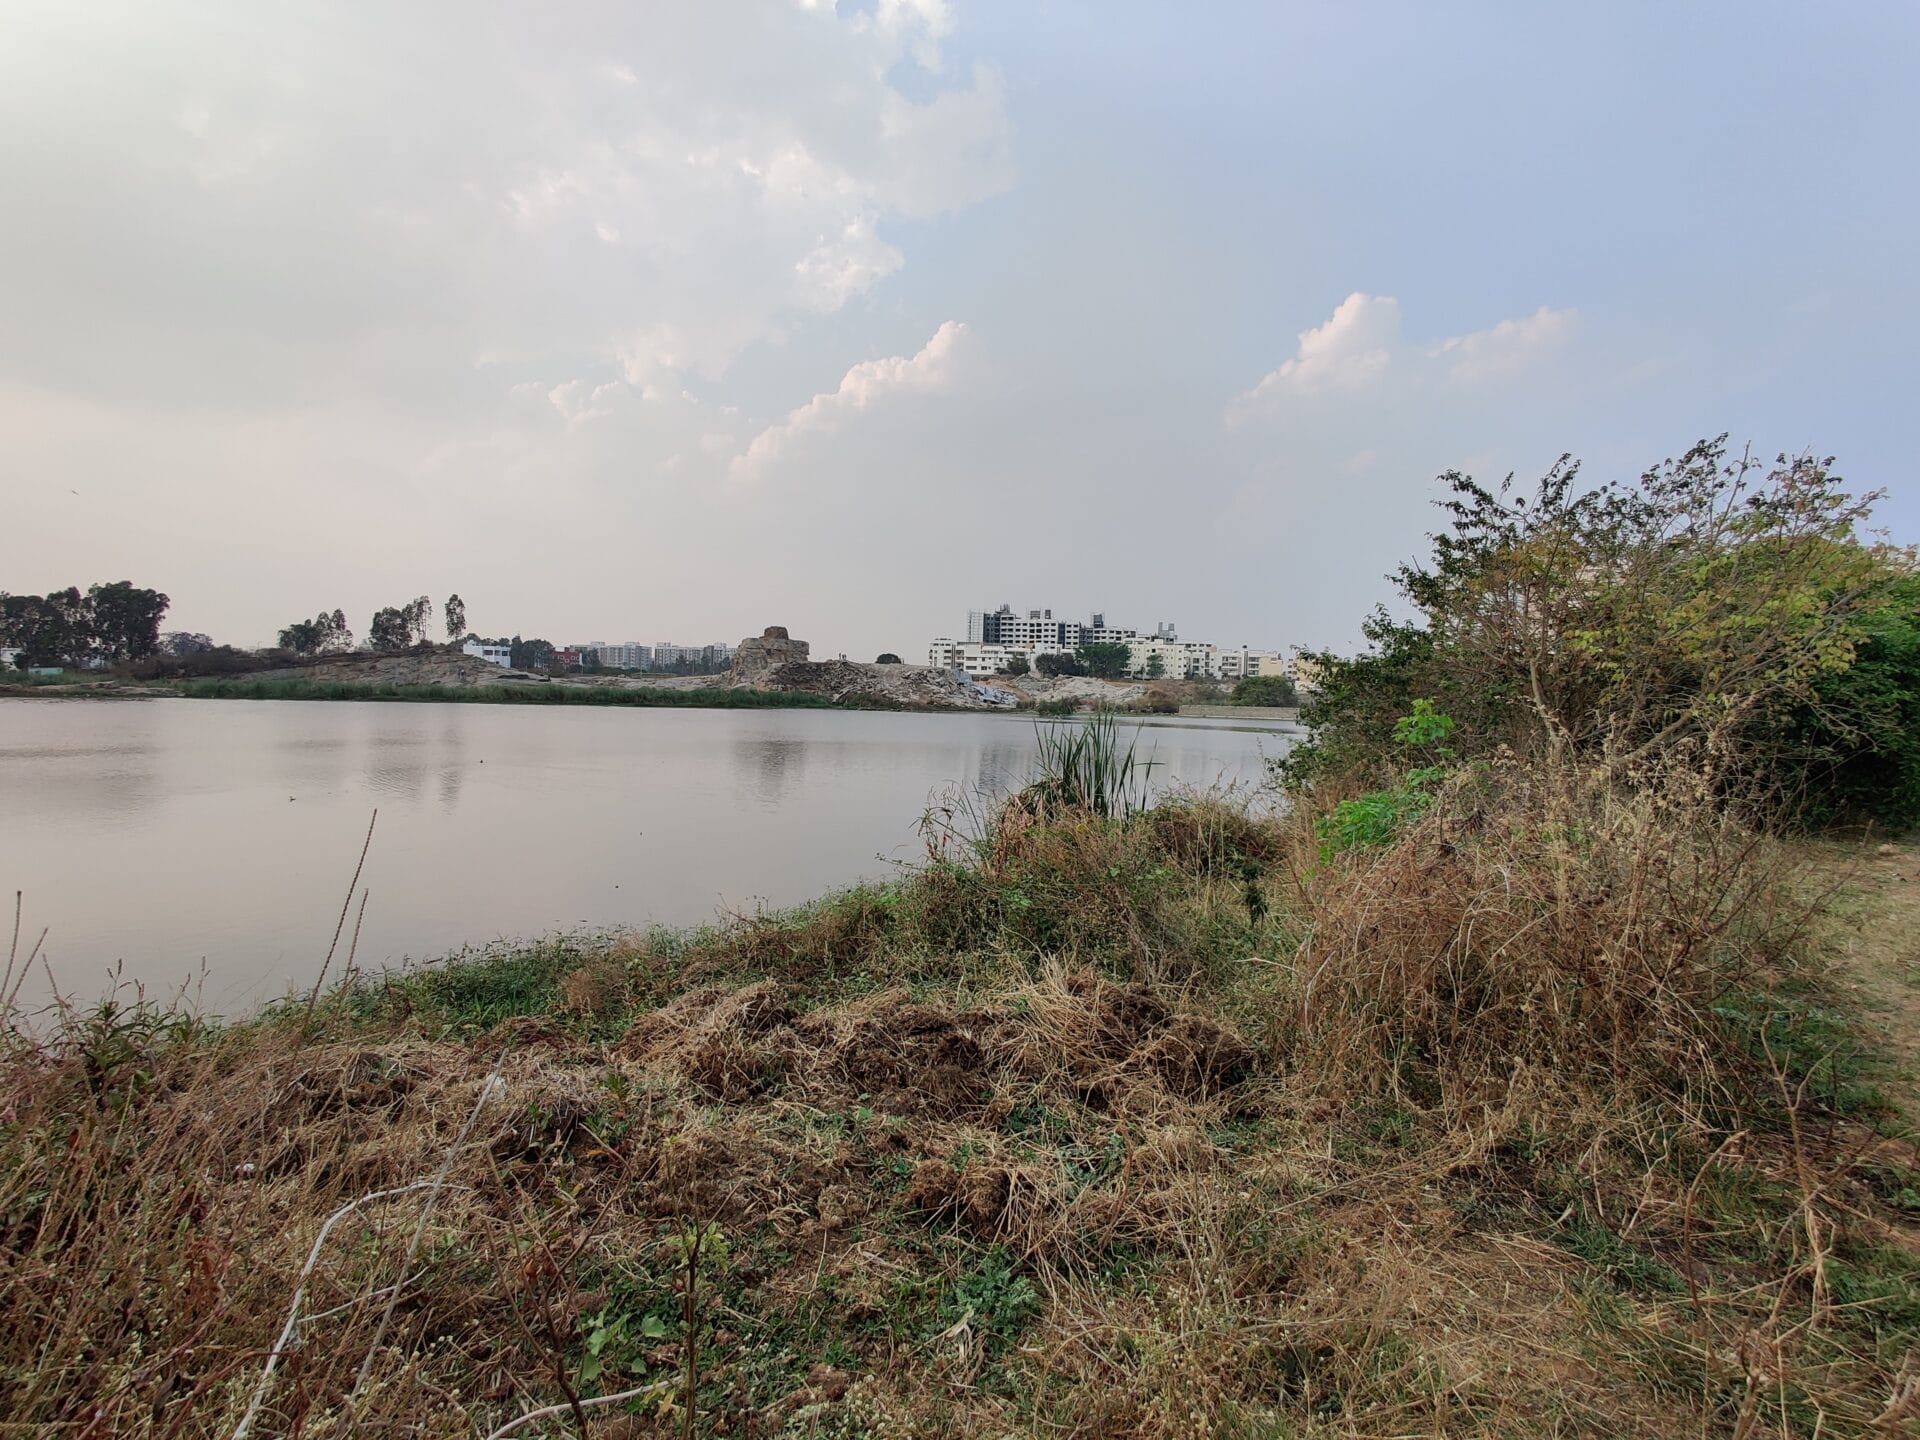
You can also choose from the list of localities on MYNA. These localities are popular, often well-birded, called hotspots from the eBird platform. Many lakes, large parks and forests can be found in this list. I chose to look at Saul Kere, a large biodiverse lake in Bellandur, which is popular with birdwatchers.
Next, choose the time period for which you want to generate summaries, from the left sidebar. The default time period is from January 1, 1900, to May 31, 2023. Birdwatchers started using eBird in India from 2014. However, there is historical data available from much earlier. If you choose the default time period, you may get bird records from decades ago, which doesn’t exist anymore. If you want a more current picture, make sure to choose a more recent date range.
The final step is to click on ‘Generate Report’ and see the summary. You can also create a PDF version of the results.
Reading the results
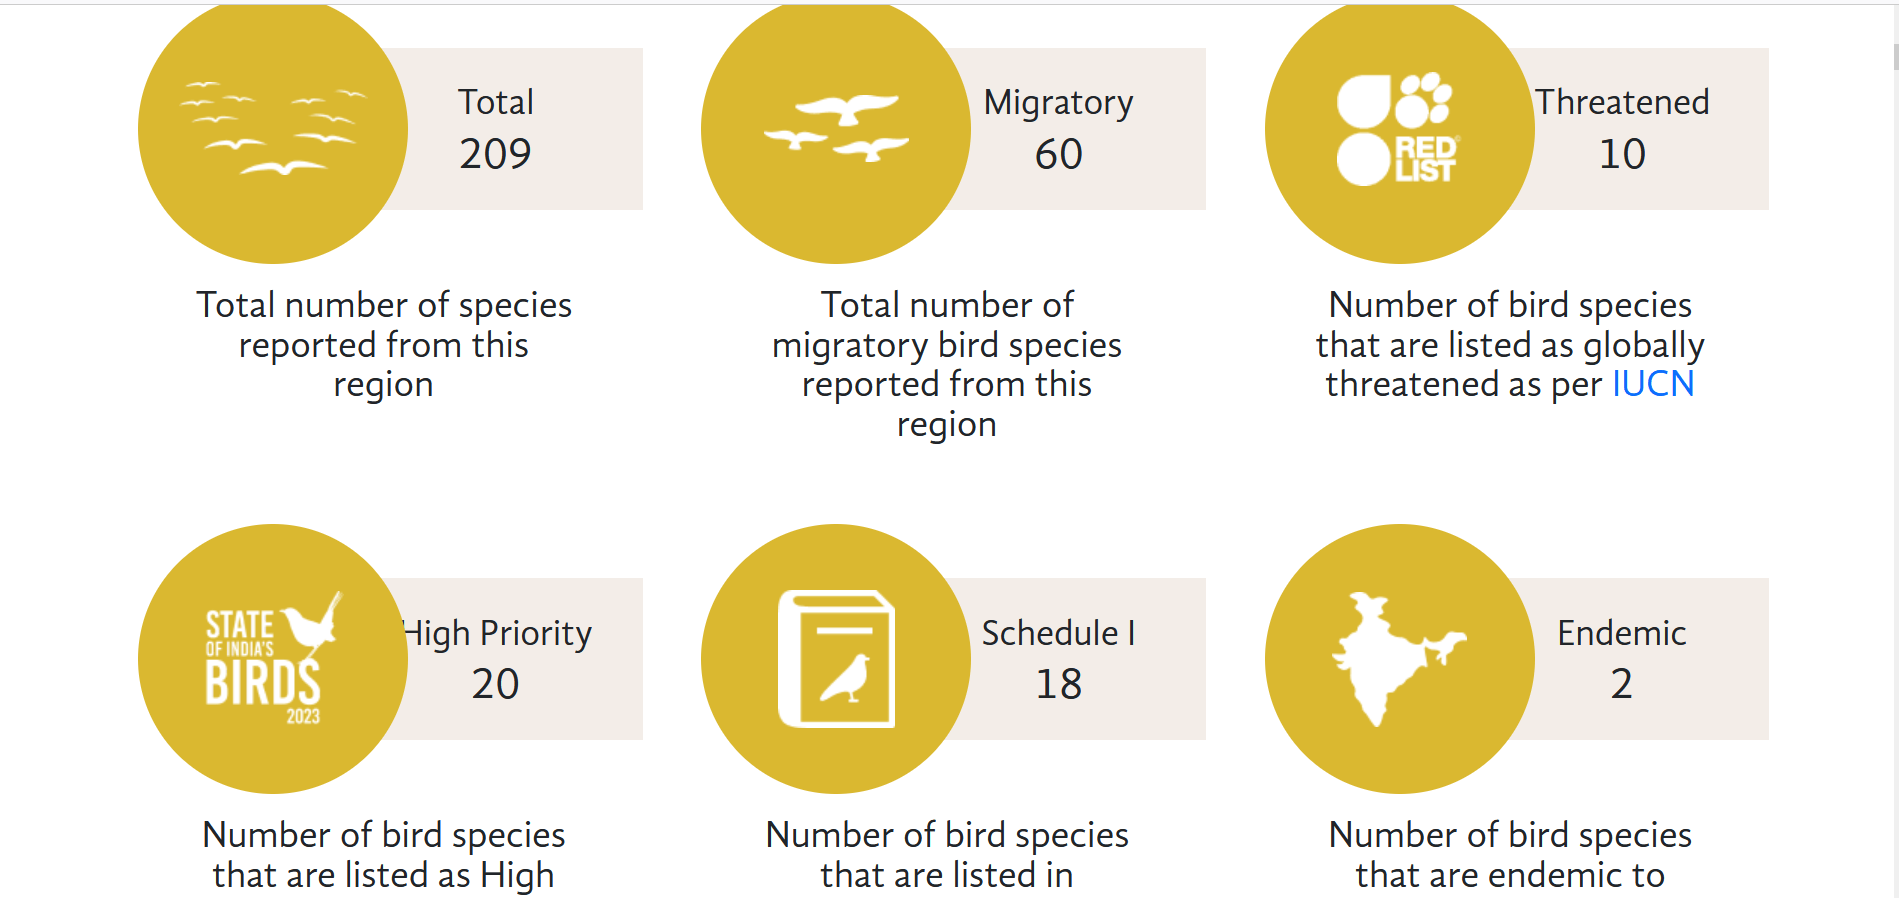
The MYNA report comprises the total number of bird species in the chosen location. It classifies the bird species by their resident and migratory status and identifies their conservation status as per the International Union for Conservation of Nature (IUCN) and their conservation priority as per the State of India’s Birds report. The latter provides a conservation status for birds in India and may differ from the IUCN’s global status.
Who can use MYNA?
The short answer is anyone. Praveen expects birdwatchers to use MYNA to understand the birds in areas around their living or workspaces. The other users would be panchayats and other local bodies, park managers of national parks or wildlife sanctuaries, or academic campuses. He also sees this as a useful tool for policymakers who may want, for example, to declare a particular wetland as a Ramsar site. “A MYNA report with a list of birds with highlights on important species will make a good annexure for their proposal,” he says.
Pic: Bhanu S
Praveen also suggests that the tool could potentially generate more accurate environmental impact assessments (EIA). He points out that assessment agencies currently depend on secondary sources and at times rapid biodiversity assessments for their EIA reports.
“At least for birds, they will be able to draw a polygon around their assessment site and obtain the data directly from MYNA,” he says.
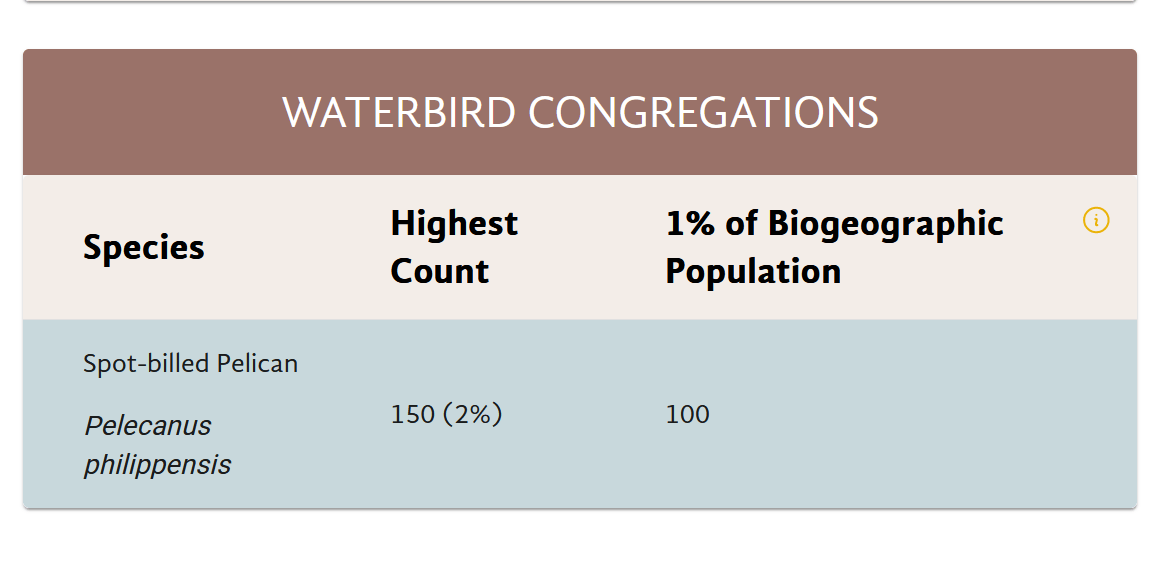
Thus, MYNA data could help ensure that EIAs are more accurate and grounded, and proposals would not go forward further in sites with high bird diversity, high densities of priority species, or large waterbird congregations.
MYNA data could help ensure that EIAs are more accurate, and proposals would not go forward in sites with high bird diversity, high densities of priority species or large bird congregations.
Read more: Biodiversity loss from mega real estate projects: What is missing, what can be done?
What can MYNA reports tell us about our cities?
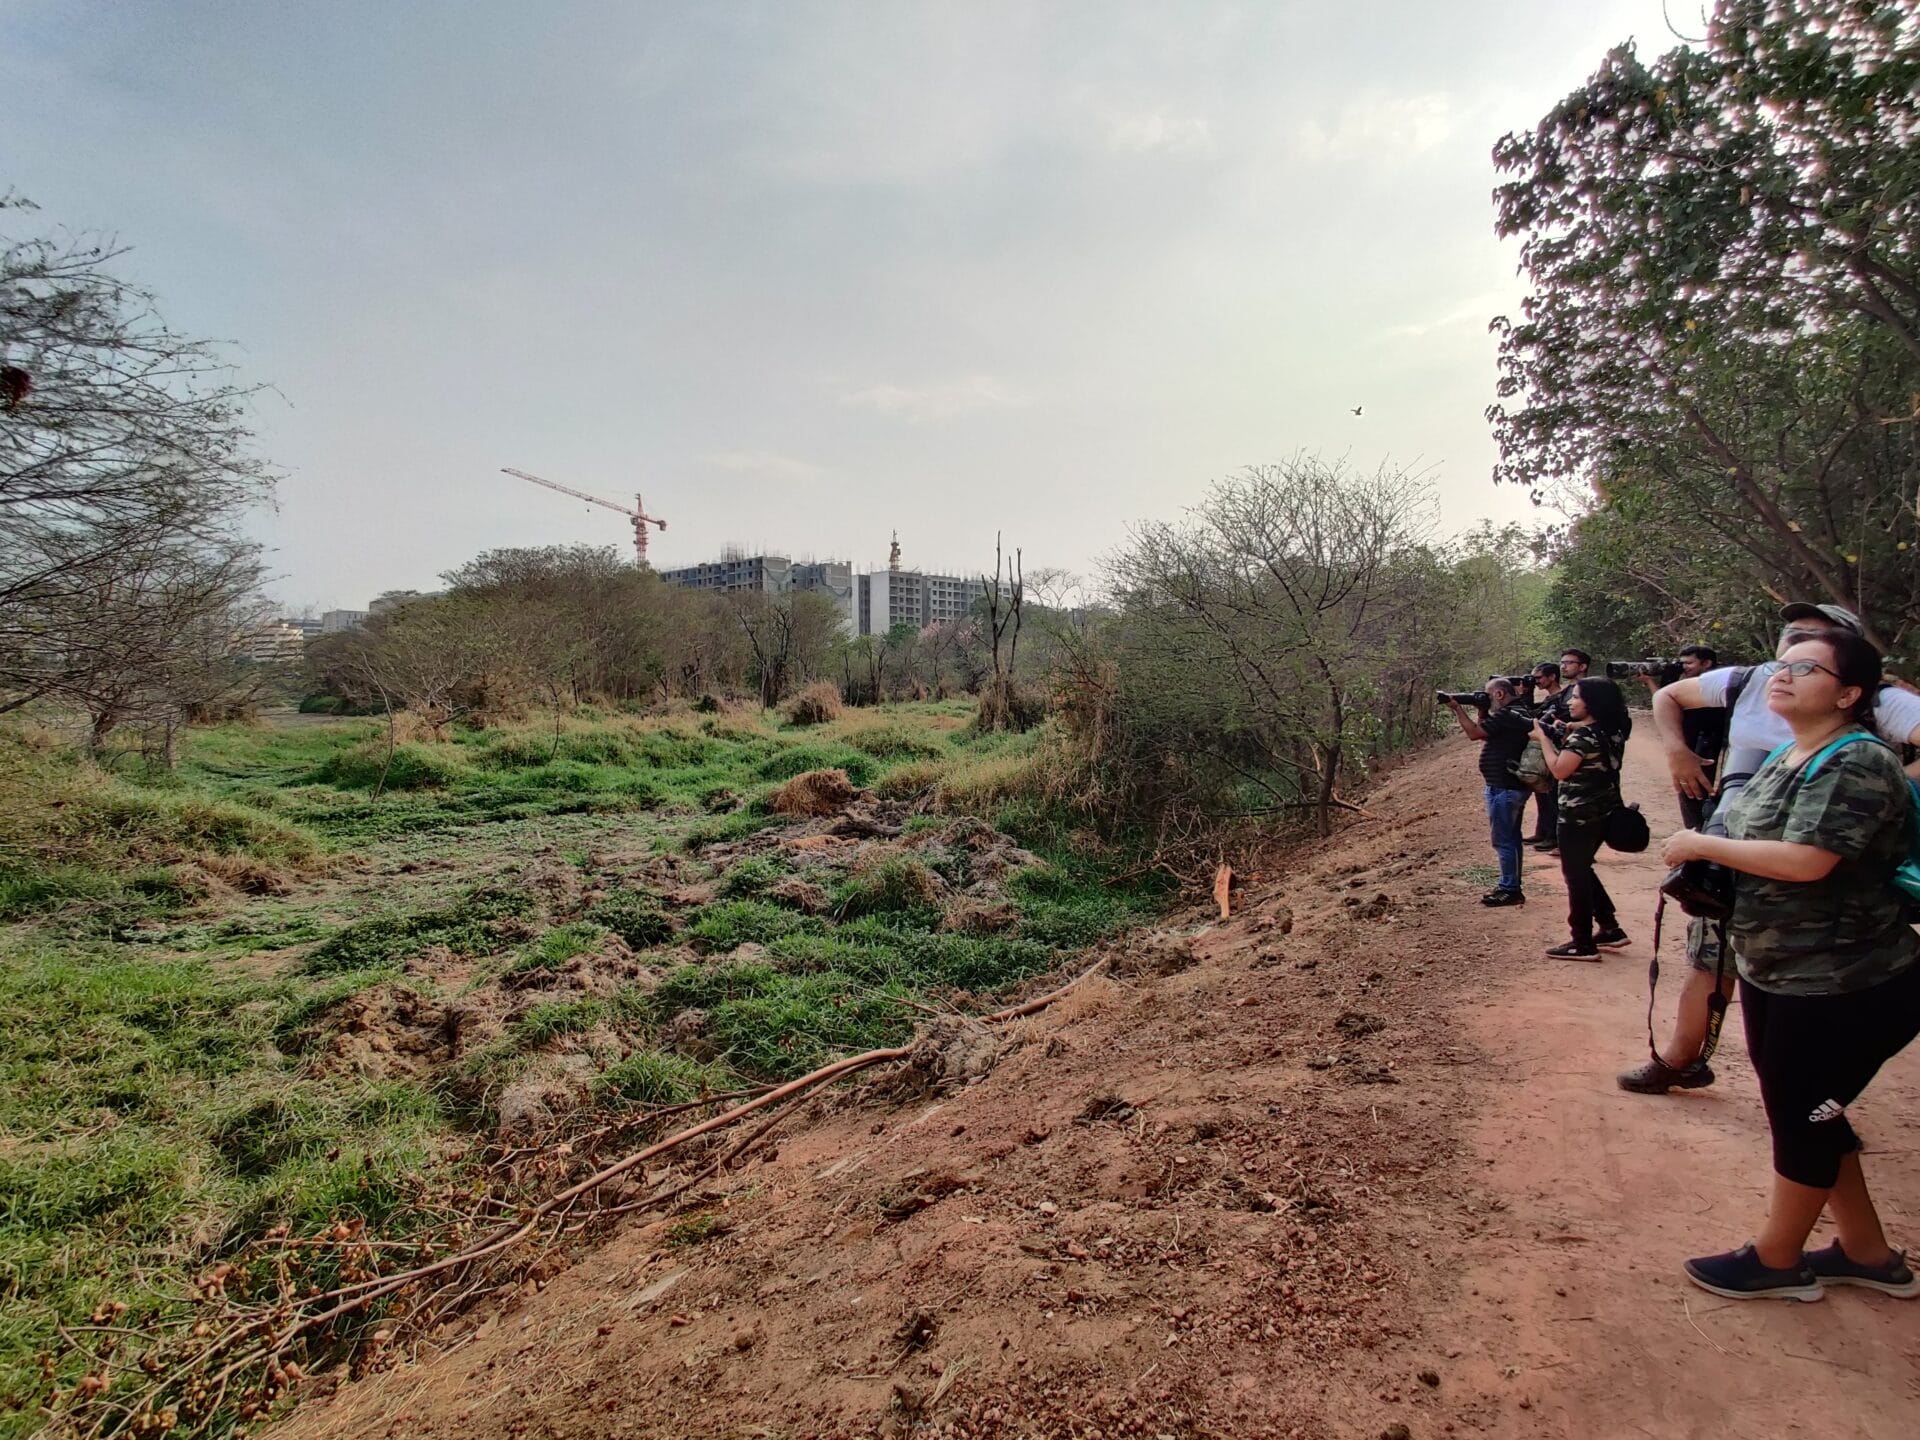
The tool, according to Praveen, has real potential in urban green spaces like lakes or small patches of forest, which are close to human habitations. He points out that the amount of data accumulated is immense in spots regularly visited by birdwatchers.
“A report from MYNA for a well-birded area can give great insights into what kind of birdlife occurs there and consequently, what kind of biodiversity potentially exists there – birdlife, in a way, is representative of the health of the ecosystem.”
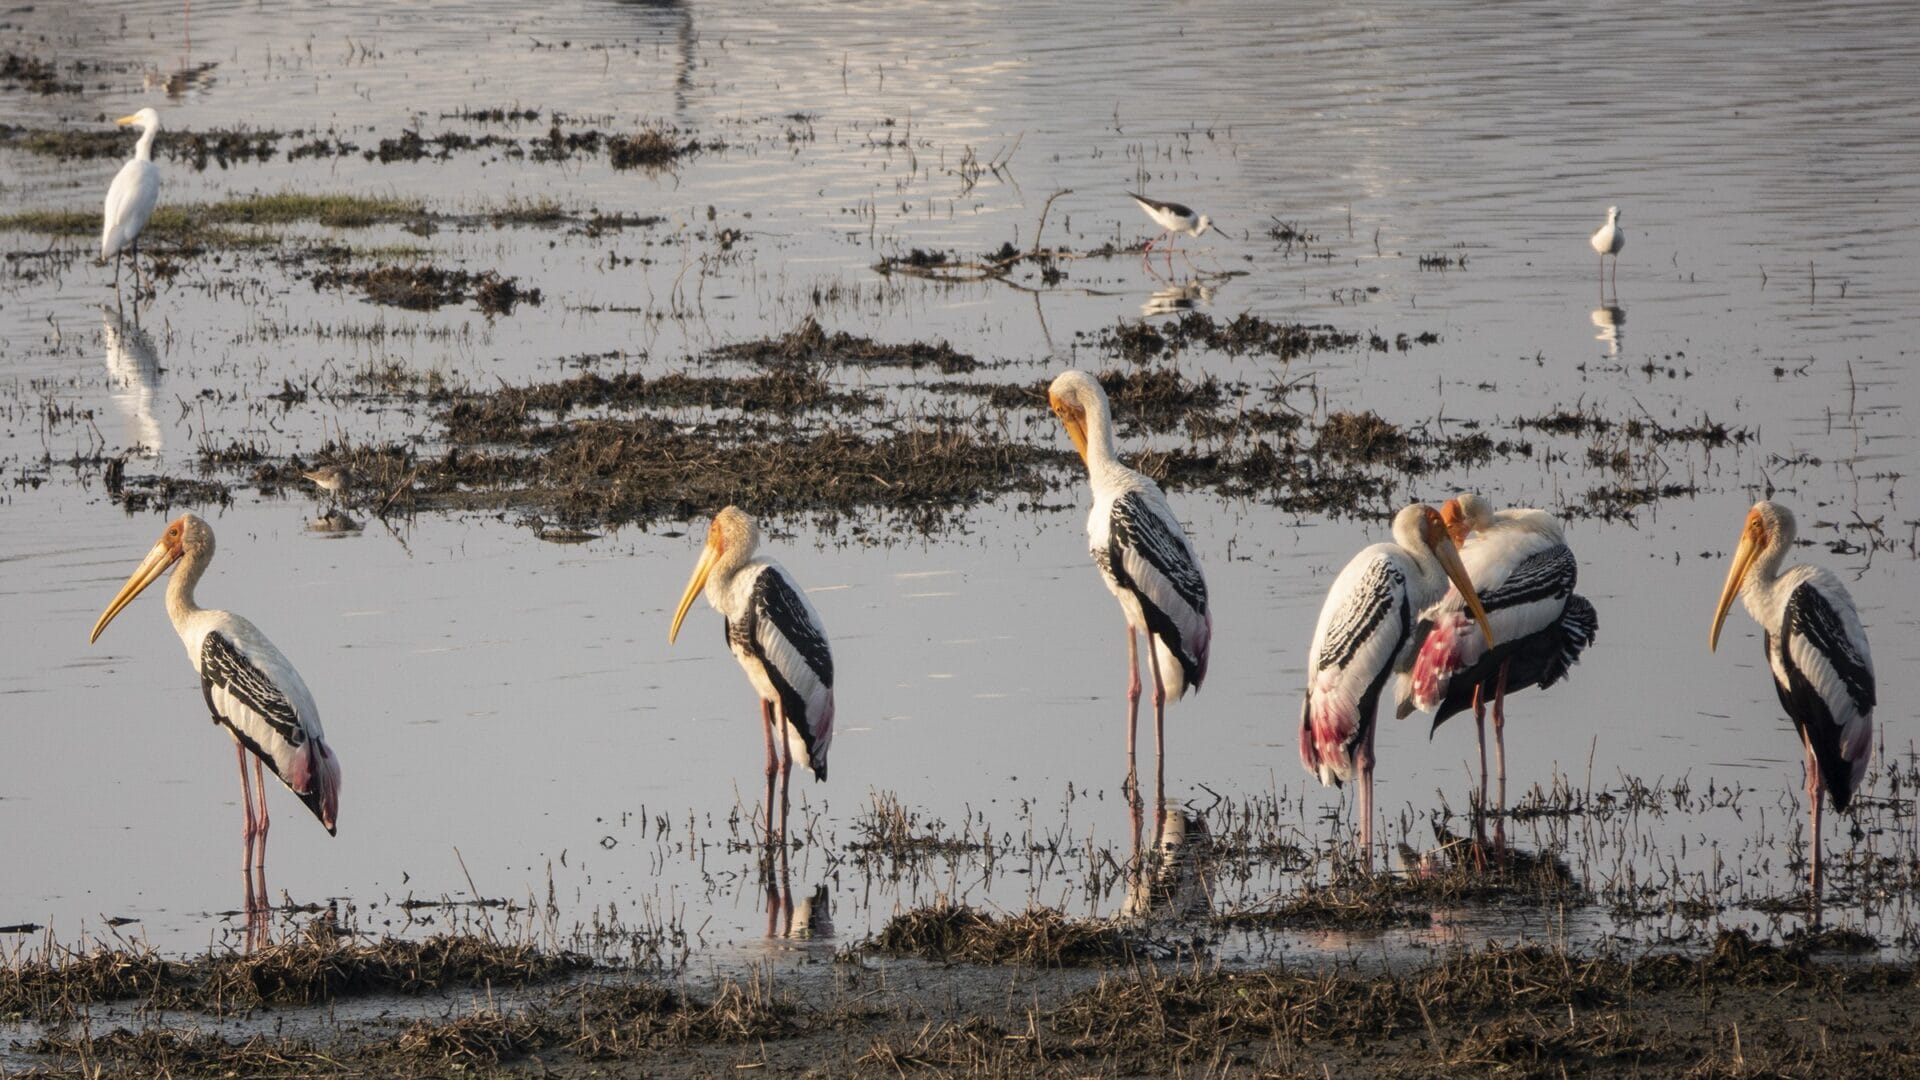
For instance, explains Praveen, if a lake has got a variety of migratory and resident waterbirds, including ducks, crakes, and egrets as well as a lot of migratory waders, it indicates the lake is diverse and has different microhabitats. “Like any good bio-inventory, we obtain an indirect assessment of the wetland and the biotic ecosystem that the lake supports.”
The report also provides information on the number of high conservation priority and threatened species. “If the frequency of reporting of those key species are higher, there can actually be a case made to stop, restrict, or reorient certain activities that are envisioned for the lake,” suggests Praveen.
Read more: How Doddanekundi lake changed my life and why we need to save it
Best practices
Praveen also sounds some notes of caution, especially while using MYNA generated reports for policy or decision making. He reminds us that the MYNA data is based on citizen contributions. Thus, areas that are well-birded and visited by birdwatchers will have better data. “If you actually tried to draw a polygon in an area where very few birders have visited, MYNA will still give you the report. However, we have to be careful in interpreting it.”
Praveen recommends that users of the tool have some familiarity with the area they are providing to MYNA. “The report is only giving a nicely formatted, concise, and comprehensive view of what is there in the database. But one should also have a general idea of what is expected to come out so that one can intervene when there are unintentional mistakes.”
For instance, Praveen points out that when we draw a polygon and generate data, MYNA gives a list of top eBird hotspots, locations that are typically well-birded, in a map. This is something that users should carefully review. “Now, by oversight, while drawing polygon boundaries, and one of the hotspots that had high bird diversity, fell just outside the polygon – then the report might miss a lot of species. Or you draw a polygon that is slightly bigger and some hotspot which is not a part of that ecosystem gets included; then the species list is inflated.”
He also recommends that the user should review the output and check if it more or less matches the eBird database. This is particularly important if MYNA reports are being used for policy decisions. In such instances, he also recommends getting local birdwatchers to vet the report. “Scientific processes need review and vetting before taking any actions, beneficial or detrimental to that particular ecosystem. MYNA reports are no exception to that,” he says.
Finally, he emphasises that the data on MYNA is currently updated till May 31, 2023, matching the data used in the latest State of India’s Birds report.
“We intend to update that data at least once or twice a year. Hence, it is not live data. So, if you have submitted three checklists yesterday, it will not be reflected in MYNA today. They will eventually reach MYNA, at a slightly delayed pace, as there is some amount of additional data verification and testing that happens in the background before we put it out in the public domain. Yes, it is slightly delayed, but it definitely gives a strong, well-curated bird dataset across the country.”
Would you find a tool like this useful? Create bird summaries using the MYNA tool for your neighbourhood, park or lake and share the PDF with us at bengaluru@citizenmatters.in