To begin with, that’s how India’s map looks like right now, if we mark the parliamentary constituencies with women Members of Parliament (MPs) in green. The chart visualised by Lokdhaba, an initiative of Trivedi Centre for Political Data at Ashoka University, shows that women’s representation has been scattered across the nation, for the 16th Lok Sabha.
The debate on having more and more women at the helm of political affairs has been a long one. The Women’s Reservation Bill promised by various political parties has remained unimplemented due to lack of political consensus.
As we head towards yet another Lok Sabha election, a citizens’ collective, Shakti, has been holding events and campaigns asking the political parties to give more tickets to women in the upcoming elections. This brings us to the question: What is the current state of affairs with respect to women’s representation? How bad is it? What more needs to be done?
Women in Parliament
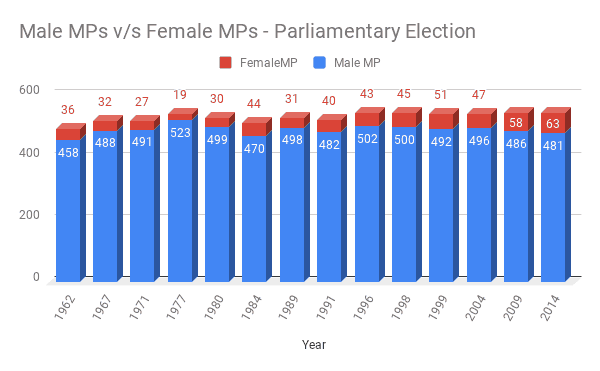
The 16th Lok Sabha has had the highest number of women MPs – in all 63 women MPs represent various parties and constituencies. A year-wise chart of womens’ representation in Parliament shows that there has been a very small but consistent increase in the number of women MPs. The chart looks like this:
 Total number of women MPs stood at 11.58% in 2014. This is way less than the 33% reservation promised in the unimplemented Womens’ Reservations Bill. The female voters who formed 47.6% of voters in India in 2014 elections remain terribly under-represented at the Parliament.**
This brings us to the next question: Which party has more women at the parliament?
Women MPs in Parliament, Partywise
The Indian election scenario has been dominated by two national parties – Indian National Congress (INC) and Bharatiya Janata Party (BJP).
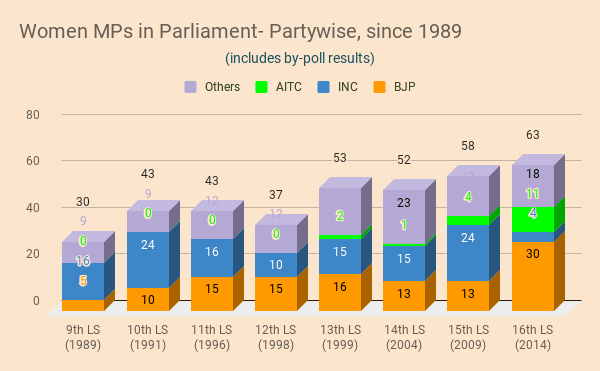
Bharatiya Janata Party has 30 women MPs (10.6%) out of 282 seats it won in the 16th Loksabha that is going to wind up soon. That is the second highest number of women MPs a single party has ever had in Indian Parliament. Indian National Congress had 40 women MPs in 1984 election, which is the highest for a single party. In 2014, however, INC that won 44 seats had just four women MPs (9.1%).**
All India Trinamool Congress (AITC) stands second with 11 women MPs in 16th Lok Sabha, out of its 34 MPs – that is close to 33% of its MPs.
The following chart shows the number of women MPs partywise for all Lok Sabhas since 1989.
| 9th LS (1989) | 10th LS (1991) | 11th LS (1996) | 12th LS (1998) | 13th LS (1999) | 14th LS (2004) | 15th LS (2009) | 16th LS (2014) | |
| BJP | 5 | 10 | 15 | 15 | 16 | 13 | 13 | 30 |
| INC | 16 | 24 | 16 | 10 | 15 | 15 | 24 | 4 |
| AITC | 0 | 0 | 0 | 0 | 2 | 1 | 4 | 11 |
| Others | 9 | 9 | 12 | 12 | 20 | 23 | 17 | 18 |
Women’s representation in state assemblies
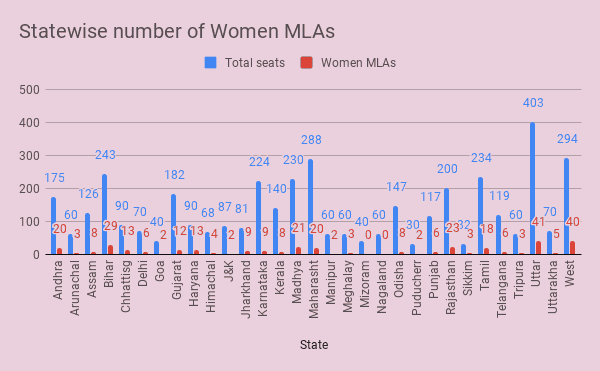
We took the data for all the current Members of Legislative Assemblies (MLAs) from all states across the nation, filtered women members and deduced charts based on that data.
Chhattisgarh and Haryana score well in terms of women’s representation, with 14.44 % of their MLAs being women. State of West Bengal comes a close second, with 40 out of 294 MLAs (13.6%) being women. It can be noted that states with higher literacy and economic indicators like Kerala, Goa and Karnataka do not fare well in women’s representation.**
Thus, the highest percentage from any state itself is 14.44, which is far off from the desired percentage of 33% in the Women’s Reservation Bill.
In terms of number of women MLAs from one state, Uttar Pradesh leads with 41 women MLAs. West Bengal stands second with 40 MLAs.
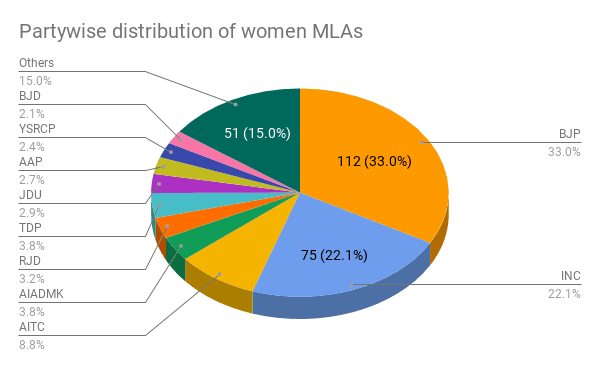
In terms of overall performance of political parties, BJP leads with their women MLAs forming 33% of the total number of women MLAs in all the states of India. Another national party INC comes second, with a share of 22.1 %. All India Trinamool Congress, which does not have much presence beyond West Bengal notably contributed 8.8% of women out of the total number for India.
| BJP | INC | AITC | AIADMK | RJD | TDP | JDU | AAP | YSRCP | BJD | Other | Total |
| 112 | 75 | 30 | 13 | 11 | 13 | 10 | 9 | 8 | 7 | 51 | 339 |
The chart below shows the partywise representation.
In fact, the numbers show that there has been an improvement from one election to the other – but it’s just not enough. If the trend of marginal 1% increase in the number of women MPs in every Lok Sabha election is allowed to continue, it will take well over a century for us to see adequate proportionate representation for women up there in the power corridors.
The data for these charts is public, and surely political parties have access to it. Is it too much to ask political parties to field more winnable women, to take the total tally higher?
Note:
- There might be minor errors in the data due to changes during bypolls which may not have been accounted for in the databases.
- Sources for data: http://lokdhaba.ashoka.edu.in/LokDhaba-Shiny, Myneta,info and different state websites.
[Disclosure: The author is a former volunteer of the Shakti’s campaign]
**Errata: Some of the information in these portions of the article were changed/clarified post publication.


