An article on New York Times says 2015 was the hottest year on earth so far. Just as 2015 made way for 2016, we have another article from Washington Post that says February 2016 was the hottest month for entire Earth!
What’s going on? Is global warming coming true? What was it like, in Bengaluru?
This February had one of the warmest days in its history
February 23rd, 2016, recorded a maximum temperature of 35.5 degree C, which is the highest temperature in Bengaluru for February since 2005. However, all-time record for February goes to a day in 2005. According to IMD officials, the hottest day in the month of February in last 148 years was 17th February 2005 – the temperature had hit 35.9 degree celsius.
Sundar M Metri, a director at the Indian Meteorological Department in Bengaluru, says that increased cloud cover reduces the maximum possible temperature, but increases the minimum temperature. The minimum temperature for February was 19 degree C, as opposed to the standard average for February, 17.2. The maximum was 35.5, as opposed to the average of 30.2. The average for each month is taken from Climatological table.
All time minimum temperature for February was 9.4 degree C, recorded in 1884.
Is temperature in Bengaluru increasing each year?
A tool compiled by New York Times shows that temperature in Bengaluru was 0.9 degree C warmer than the average normal. Average for Bengaluru is 24.7 degrees, while the tool shows an average of 25.6 degree Celsius.
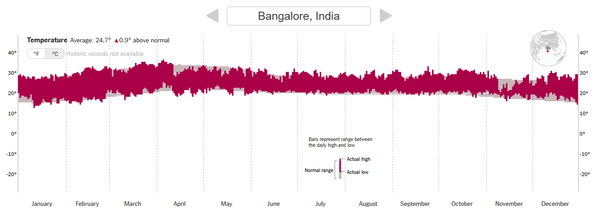
Temperature graph from New York Times for 2015.
While temperature in Chennai was 0.8 degree C below normal, Delhi was only 0.5 degrees above normal. Colombo in Sri Lanka was 1.2 degree warmer than the normal in 2015.
Another graph from Accuweather shows that both maximum and minimum temperatures were constantly higher than average in February 2016.
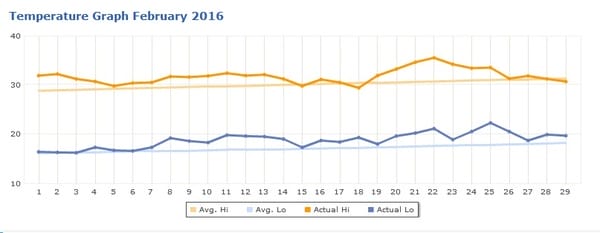
Graph from Accuweather for February 2016.
We couldn’t verify the phenomenon through IMD data, because the data is not open to all.
What is Climatological table?
Indian Meterological Department makes use of climatological tables. Climatological table is a table of average temperature for a 30-year time band, that has maximum and minimum temperature averages for all 12 months of the year calculated by taking into consideration the timeband between the years considered. The timeband used by IMD-Bangalore is 1971-2000. Next scale, ranging from 1981 to 2010 is expected to be released by IMD, till which time the data will have to be tallied with the old scale.
Will this timeband be relevant for today’s Bangalore? It may not be, say the sources in IMD. The landscape and green cover in Bengaluru saw much changes in the years, with the city expanding constantly, more and more areas being built up and more and more greenery making way for buildings and roads.
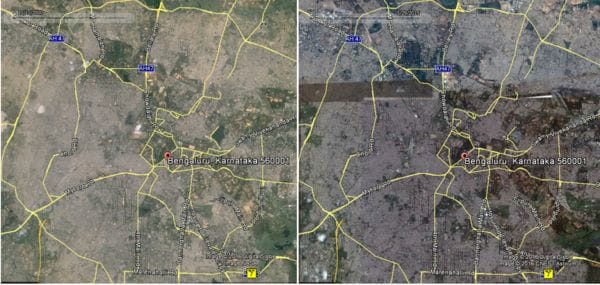
Google Earth comparison of landscape of core Bangalore area between 2000 and 2015.
How is temperature measured by IMD?
The Bengaluru branch of Indian Meteorology Department (IMD) was set up in 1867, 10 years after the Sepoy Mutiny. The weather data is recorded here with the internationally accepted standards and techniques, specified by the World Meteorological Organisation.
Sources in Climatology section of IMD say that the temperature is recorded at 4 feet height, using a thermometer. The thermometer is placed in Stevenson’s screen. (Stevenson screen, as defined by Wikipedia, is a meteorological screen meant to shield instruments against precipitation and direct heat radiation from outside sources, while still allowing air to circulate freely around them. It forms part of a standard weather station.)
Related Articles
It’s rainiest November in Bengaluru since 1916; more to come!
Data from 100 years reveals the rainiest months in Bengaluru