This article is supported by SVP Cities of India Fellowship |
Travel. The word conjures a myriad of images. Glorious sunsets, exotic locations, fascinating culture… Similarly “travel in Bengaluru” also has many images associated with it, though none of them are terribly complimentary – in fact they sound quite nightmarish.
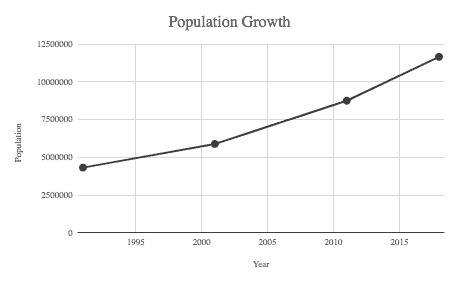
The vehicle population has grown faster than in any other city. Recent reports mentioned how Bengaluru has breached the 77 lakh mark – with 54 lakh two wheelers and 15 lakh cars.

Graph Source: WRI
Bengaluru is the fifth largest metropolitan city in India in terms of population but just second in terms of vehicle population. To accommodate the ever-growing city, we needed connectivity and roads. How did that grow?
Connectivity and Road Network in Bengaluru
Basavaraj Kabade, Executive Engineer, Road Infrastructure, Bruhat Bengaluru Mahanagara Palike estimates that the total road network in Bengaluru is about 14,000 kms and total motorway road network is about 2,200 sq kms including arterial and sub arterial roads as on March 2018 – up from 1,831 sq kilometers in 2011. The road length per sq kilometer is about 8.2 kms.
Though Bengaluru developed radially, besides the Outer Ring Road, there is no other circumferential road system to reduce traffic that needs to go through the city centre. The Peripheral Ring Road even when it gets ready is too far from the city centre. The layouts that grew off the arterial roads like Old Madras Road, Kanakapura Road or Sarjapur Road are not accessible by alternate roads. This has meant the arterial roads and Outer Ring Road are heavily choked.
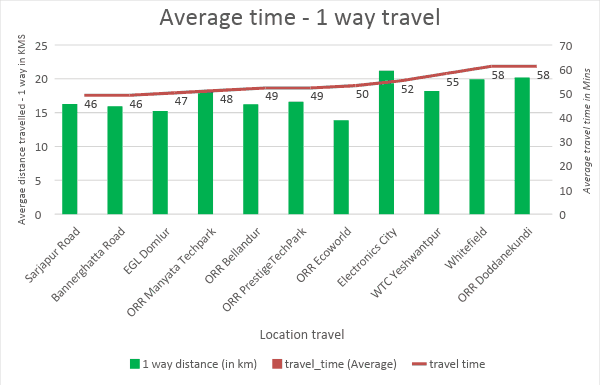
Thanks to all this, the average speed of travel during peak hour in Bengaluru is 17 km per hour. The travel time of an average Bengalureanan has increased by 6% in just one year according to a study Bengaluru City Office Commute Report by MoveInSync (a firm that makes office commute automation platform).

Graph Source: MoveInSync
In parallel, with the increase in the buying power of the consumer, private vehicles boomed in Bengaluru.
The story of private vehicles in Bengaluru
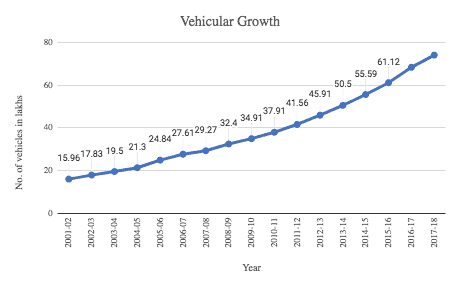
In 2007, the number of cars registered in the city were 3,44,053. By 2011, this figure 7,10,852. In 2018, this number has increased to 14 lakhs cars alone. The two-wheelers went from 14,46,807 in 2007 to 26,24,707 in 2011. In 2018, the number for two-wheelers has crossed50 lakhs,. despite the fact that the road infrastructure has been very poor. This means more than a 70% rise in the private vehicular population.
This follows the national pattern of a boom in private vehicles, where in six years between 2008 to 2016, 10.5 crore vehicles have been added around the country on our roads. To put that in perspective, it took us the first 60 years of our independence to touch the 10 crore vehicles. If we look at it specifically in the context of cars alone, the first 1 crore cars took 55 years (from 1951) to get on Indian roads. And next 1 crore got added in the next ten years from 2006 to 2016.

Graph: WRI. Data Source: http://transport.karnataka.gov.in/index.php/information/details/archive_vehicle_statistic
However, did the public transport system grow with similar exuberance?
Whither public transport?
While there are other mass transit systems that operate in Bengaluru – 180km of suburban rail track that criss-crosses across 45 stations that cover some major sections of the city; the metro system with 41 stations with 42.30 kms of track – the most effective mass transport still remains the bus system.
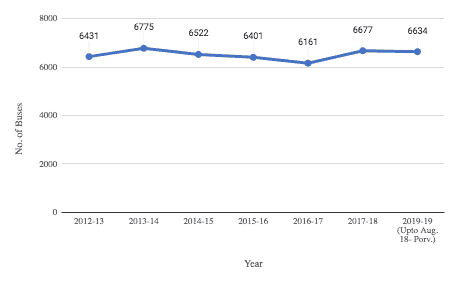
The current fleet strength of the BMTC is 6650 with 6139 schedules. The total number of service kms are 11.77 lakh kms with about 70,892 trips and 51 lakh tickets. In 2011, there were 6111 buses with a 2400 bus routes and carried 43 lakh passenger trips.

Graph: WRI. Data source: http://www.mybmtc.com/en/performance-indicator
Net result: Serious air pollution
All the vehicular density and lack of infrastructure has resulted in us breathing heavily polluted air, containing particulate matter and poisonous gases like Carbon Monoxide and Ammonia from vehicular emissions. The World Health Organisation (WHO) pegs air pollution to be the 13th cause of worldwide mortality, and 5th biggest killer in India.
In 2016, four academics published an article in the International Journal of Environment Technology and Management that analysed eight years of air pollution data in Bengaluru from 2006 to 2013. The report stated that the suspended particulate matter in the air has gone up from 71.0 gms in 2006 to 128.0 in 2013 even in a residential area like Yeshwanthpur. It has been classified as critical as the acceptable standard is about 60 gms.
Urban Emissions calculates vehicular emissions to be contributing 26.5% of Bengaluru’s air pollution – the single largest source!

Source: urbanemissions.info
The numbers make the reality quite clear. To accommodate the growing population of our city, we increased built up area and road network at the cost of green spaces and water bodies. While private vehicles increased by 5 times in less than 20 years, public transport has barely gone up.
The writing on the wall is clear. Without a robust public transport and other measures to discourage private vehicles, air quality can only get worse.
Meera K contributed to this story.
This article is supported by SVP Cities of India Fellowship.
|
It’s high time to take some strict measures before things get worst