OpenCity.in, on April 1st 2023, organised a datajam at the Indian Institute of Management (IIM), Bangalore to analyse data of various sectors-education, civic participation, and mobility-for all the 28 Bengaluru Assembly constituencies. The event brought together participants from diverse backgrounds, including urban designers, policy wonks, GIS experts, developers, data scientists, and more.
This article highlights the team’s findings in education.
Problem statement
How many students are there per constituency population? Are there enough staff and facilities in the schools to serve these students?
Background
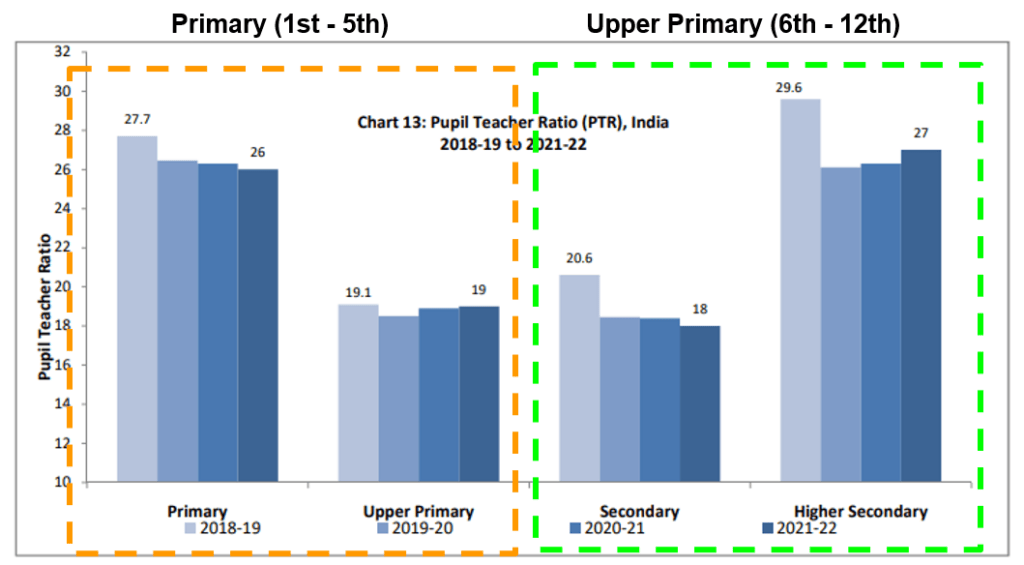
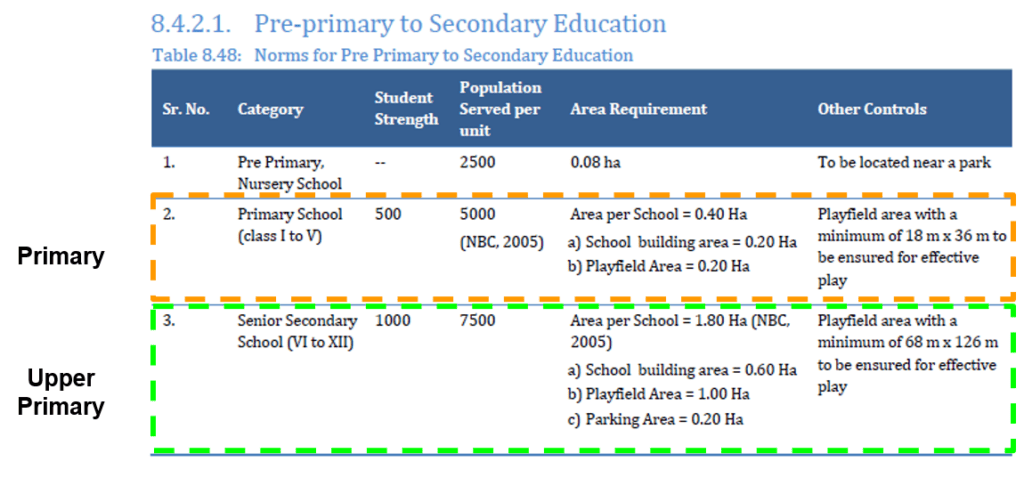
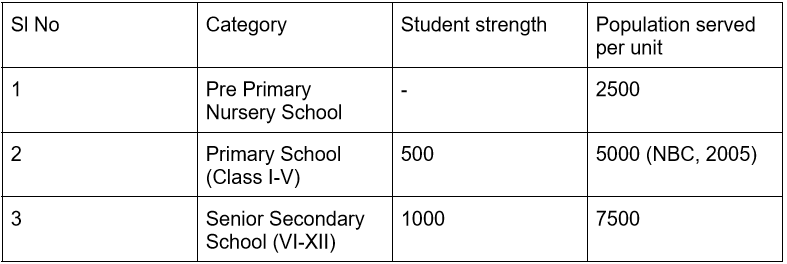
We started out by asking basic questions on what constitutes education and the basic infrastructure needed for different schools and grades. We obtained this information from the Unified District Information System for Education Plus(UDISE+) report (see chart below) from the Ministry of Education, Government of India.
District-wise availability of infrastructure and facilities
We initially looked at the number of schools and who they were managed by in the three districts of Bengaluru rural, Bengaluru North and Bengaluru South.
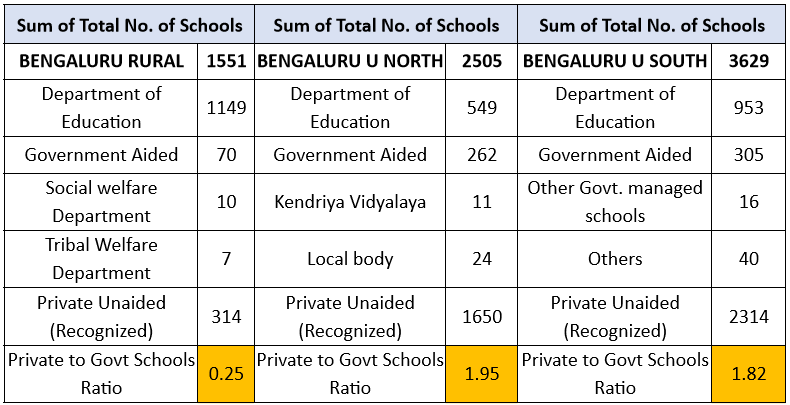
We found that there is a high ratio of private to government schools in urban areas. In stark contrast, the ratio is very small in neighbouring rural areas.
Read more: A few low cost private schools attempt to bridge the learning gap
District-wise infrastructure availability
We created heat maps of common facilities available across school categories in each of the three districts. We express the availability of various facilities like medical checkups, toilets, hand wash areas, ramps, etc, in percentage terms. This availability is colour coded red for 0%, yellow for 50%,and green for 100%. Any number between 0% and 50% is a mix of red and yellow, and likewise a number between 50% and 100% is a mix of yellow and green. This heat map allows us to visually identify the areas requiring attention and improvement.
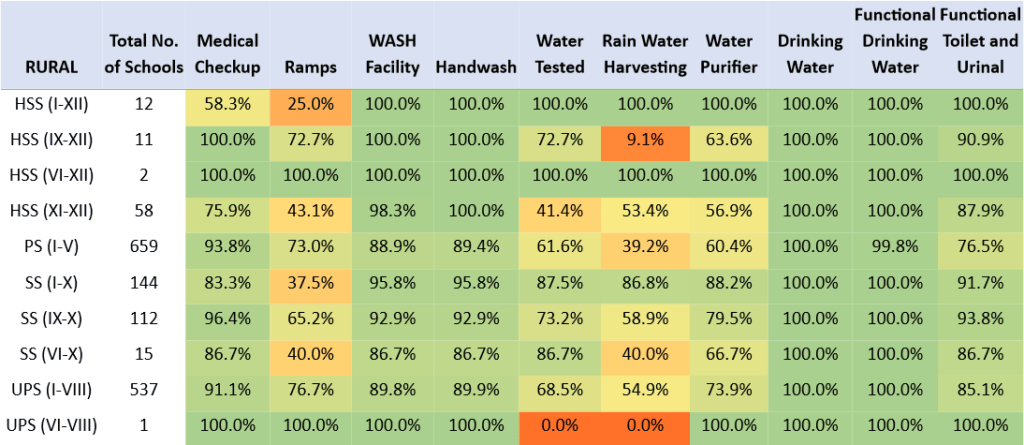
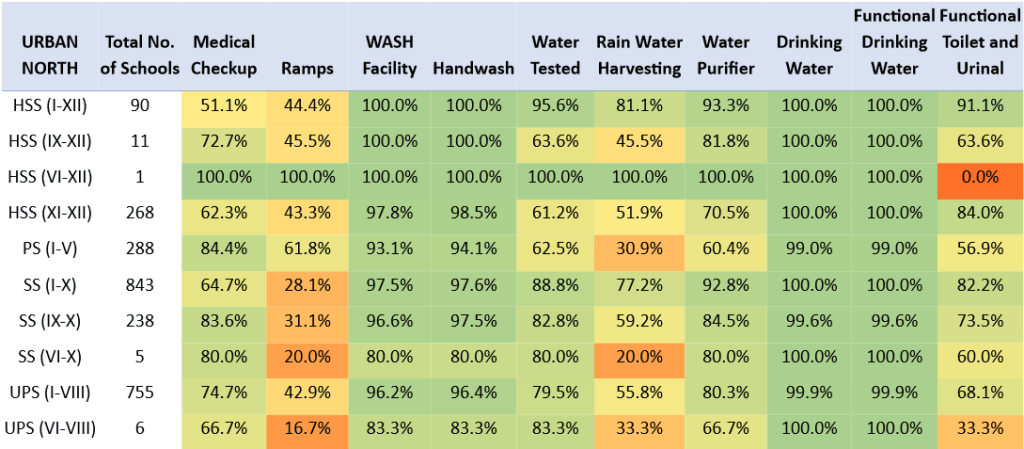
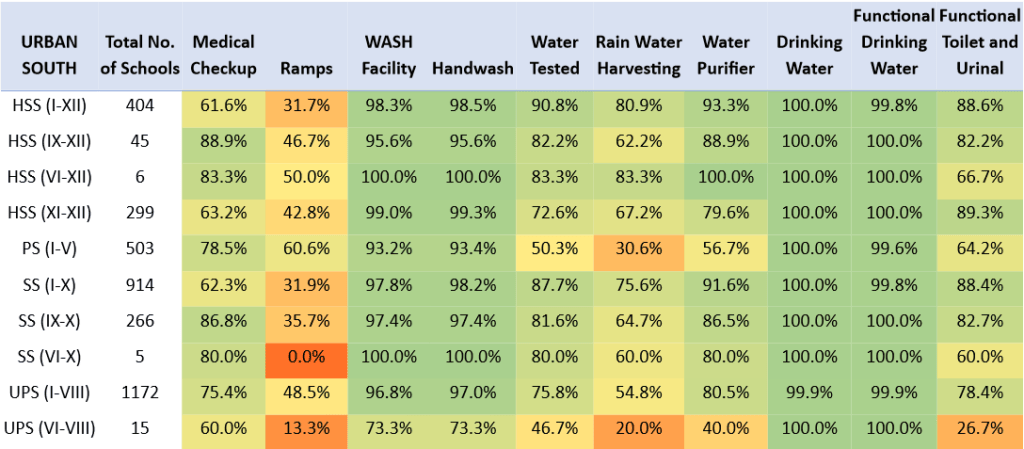
We found that many schools don’t have functional toilets/urinals and lack medical check-ups on a regular basis.
Read more: Students in this govt school excel against all odds
Classification of public and private schools
The constituency-wise distribution of public and private schools is as shown below:
| Assembly Constituency | Private Schools | Government schools |
|---|---|---|
| B.T.M Layout | 48 | 22 |
| Bangalore South | 103 | 38 |
| Basavanagudi | 50 | 6 |
| Bommanahalli | 101 | 26 |
| Byatarayanapura | 82 | 45 |
| C.V. Raman Nagar | 49 | 27 |
| Chamrajapet | 63 | 30 |
| Chickpet | 66 | 21 |
| Dasarahalli | 104 | 30 |
| Gandhinagar | 50 | 22 |
| Govindarajanagar | 73 | 19 |
| Hebbal | 80 | 19 |
| Jayanagar | 61 | 10 |
| K.R. Puram | 100 | 60 |
| Mahadevapura | 42 | 38 |
| Mahalakshmi Layout | 96 | 13 |
| Malleswaram | 51 | 18 |
| Padmanabhanagar | 84 | 15 |
| Pulakeshinagar | 92 | 19 |
| Rajajinagar | 70 | 14 |
| Rajarajeshwarinagar | 118 | 31 |
| Sarvagnanagar | 92 | 31 |
| Shantinagar | 33 | 26 |
| Shivajinagar | 62 | 16 |
| Vijayanagar | 85 | 17 |
| Yelahanka | 30 | 21 |
| Yeshwanthpura | 84 | 46 |
Access to schools as compared with population
URPFI guidelines provides a recommendation for city planners and administrators on how physical and the social amenities can be planned with respect to the population. Using the same norms, we have tried to understand where each of the wards stand in terms of accessibility to schools and the population it covers. The population data at the ward level is the 2011 Census and the schools’ location datasets are from the KGIS database scraped by OpenCity.in.
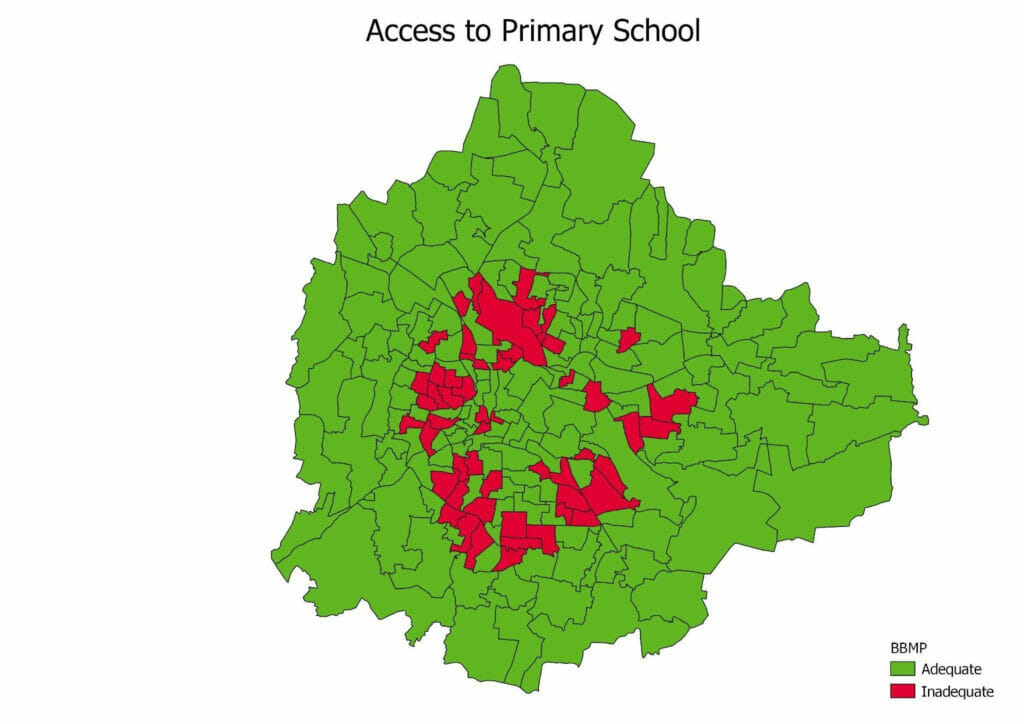
Primary schools
The analysis revealed that 51 out of the 198 wards had an inadequate number of primary schools with respect to the ward population. Wards such as Basavangudi and Girinagar (deficit of five primary schools each) had the maximum deficit as compared to the other wards. Jakkur ward (surplus of 37 primary schools) had a high surplus of primary schools.
Secondary Schools
Similarly, analysis showed that nine out of the 198 wards had inadequate number of secondary schools with respect to their ward population. Wards such as Katriguppe, Subash Nagar and Padarayanapura (deficit of two secondary schools each) had the most deficit. HBR layout ward (surplus of 34 secondary school) had a high surplus.
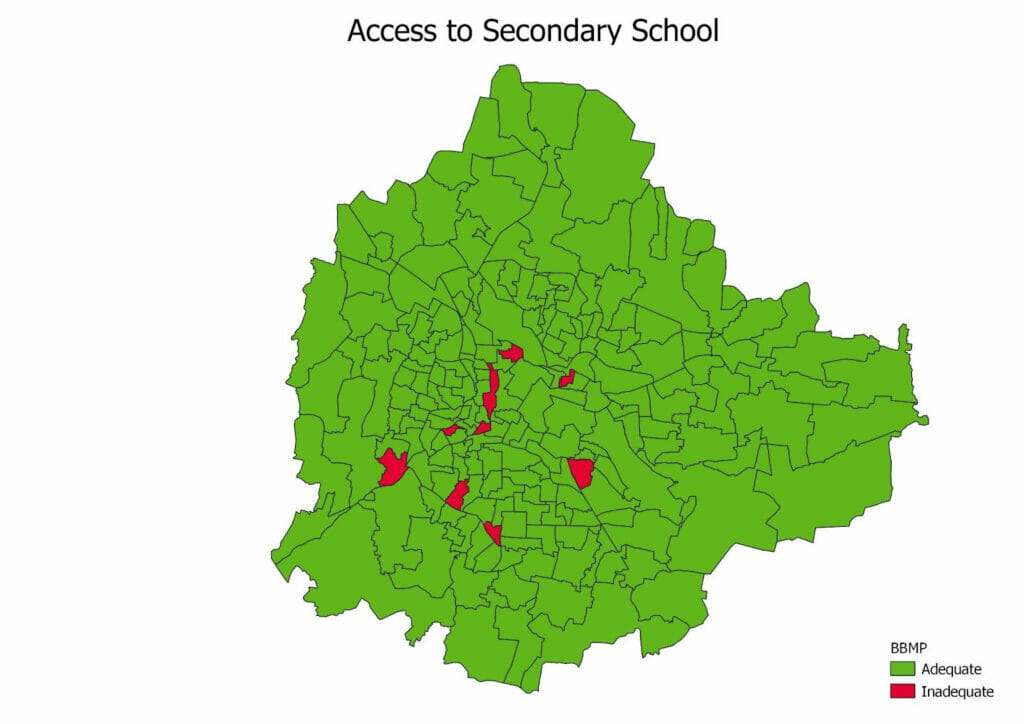
Four wards were found to be having inadequate number of both primary as well as secondary schools: Chalavadipalya (Chamarajpet Assembly constituency (AC), Rajamahal Guttahalli (Malleswaram AC), Shivaji Nagar (Shivaji Nagar AC), and Katriguppe (Basavanagudi AC).
School rating based on amenities
Rating calculation method
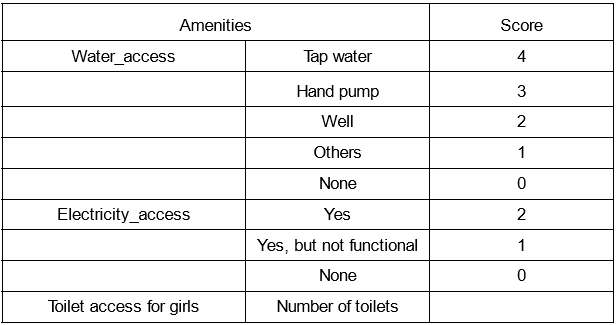
All schools were categorized based on availability of three basic amenities – access to water, electricity and toilet facility for girls. The schools were given a higher rating if the access to water was easier (say from a tap) and lesser scores if the access to water was difficult (say from a hand pump or a well or no access at all).
For electricity, schools were given higher scores if electricity was available and lower if not. The number of toilets available for girls was considered as it is.
These scores were added to arrive at an amenities score at the school level. These scores were normalized to bring them on a scale of 0 to 1 for ease of interpretation. Looking at the distribution and using the mean score to divide the data, two sets of categories – high and low – were created to classify schools based on the basic amenities that they provide.
These individual scores for the schools were then added by constituency type and divided by the number of constituencies to arrive at a composite score at the constituency level.
Interpretation
The schools are classified into ‘high’ and ‘low’ based on their performance in the composite amenities score (based on water, electricity and toilet access for girls). The schools that are able to provide all these facilities adequately would have received a higher score. Those that lacked some or all of these facilities (at the desired level) would have received a lower score. Data shows a certain number of schools in each constituency performing ‘low’ on availability of amenities while some fell into the ‘high’ category.
| Assembly Constituency | Assembly Constituency | Assembly Constituency |
|---|---|---|
| B.T.M Layout | 39 | 31 |
| Bangalore South | 82 | 59 |
| Basavanagudi | 24 | 32 |
| Bommanahalli | 85 | 42 |
| Byatarayanapura | 88 | 39 |
| C.V. Raman Nagar | 44 | 32 |
| Chamrajapet | 59 | 34 |
| Chickpet | 43 | 44 |
| Dasarahalli | 92 | 42 |
| Gandhinagar | 47 | 25 |
| Govindarajanagar | 66 | 26 |
| Hebbal | 49 | 50 |
| Jayanagar | 43 | 28 |
| K.R. Puram | 84 | 76 |
| Mahadevapura | 56 | 24 |
| Mahalakshmi Layout | 65 | 44 |
| Malleswaram | 37 | 32 |
| Padmanabhanagar | 58 | 41 |
| Pulakeshinagar | 67 | 44 |
| Rajajinagar | 51 | 33 |
| Rajarajeshwarinagar | 91 | 58 |
| Sarvagnanagar | 65 | 58 |
| Shantinagar | 28 | 31 |
| Shivajinagar | 29 | 49 |
| Vijayanagar | 66 | 36 |
| Yelahanka | 39 | 12 |
| Yeshwanthpura | 93 | 36 |
The inference from this data is that the local representative of the constituency should focus on those schools in his area which has a lower amenities score and ensure these basic amenities are provided.
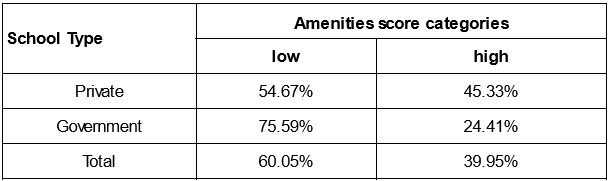
By aggregating schools across all constituencies by type, we can see that 76% of government schools scored low on amenities as compared to 55% of private schools. The amenities score is aggregated at the constituency level to understand which constituencies are performing better or worse than others when it comes to provision of basic amenities in schools.
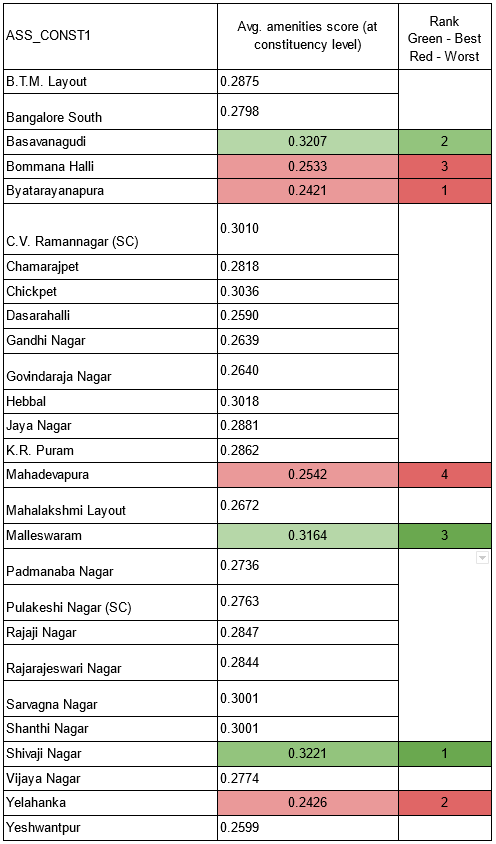
Looking at the aggregate constituency level amenities score, it can be observed that Shivajinagar, Basavanagudi and Malleswaram are the best performing constituencies while Byatarayanapura, Yelahanka, Bommanahalli and Mahadevapura are the worst performing ones.
The local administration could target the worst performing constituencies first and then move to those with relatively higher scores so as to improve access to basic facilities in all schools.
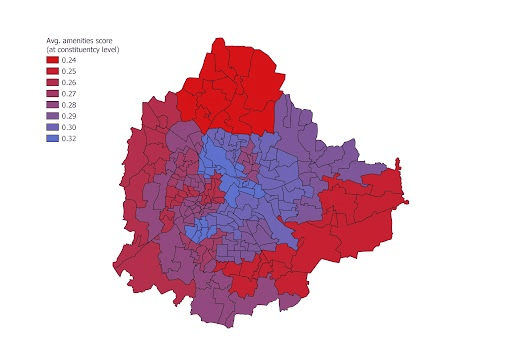
It can be seen that schools with better amenities are located in central Bengaluru whereas as one moves outwards from the city center towards the periphery, the schools seem poorly equipped in providing basic amenities of water, electricity and washroom access for girls.
Recommendations
- We suggest that MLAs of the lagging constituencies take up the recruitment of teachers and checking of infrastructure in schools as we return to normal educational delivery.
- We also feel that citizens need to be more vocal about the educational needs of their children and push for better physical and technological infrastructure at schools in their wards.
Sources
- Ministry of Education, GoI (2021). Unified District Information System for Education Plus (UDISE+) 2020-21.
- Ministry of Education, GoI (2022). UDISE+ dashboard for 2021-2022, report ID 3013.
- Ministry of Human Resource Development, GoI (2017) Student-Teacher Ratio.