One of the important pillars of democracy is civic participation in the processes of governance. Participation by citizens in their local governance can vary from something as simple as turning up to vote in elections – general, assembly and local body-to registering their grievances with the local bodies and participating in ward committee meetings.
In the “Bengaluru constituencies datajam”, conducted on 1st April, at the Indian Institute of Management (IIM), Bangalore, we looked at publicly available data to evaluate the 28 assembly constituencies in Bengaluru Urban district on their civic participation.
Problem statement
Rank Bengaluru’s constituencies in terms of civic participation in their local governance.
Data sources
- Assembly election results from 2018, 2013 and 2008 from the Election Commission of India.
- BBMP election results from 2015 and 2010.
- Ward committee meetings data from BBMP’s website.
- Data from Fix My Street, BBMP’s public grievances logging app.
- Data from GPMS online complaint logging system of BBMP.
- Data from Janaagraha’s ‘I Change My City’ portal where citizens can log their grievances and complaints.
Methodology
- Assembly election turnouts: The election results for the 28 constituencies in Bengaluru Urban district were collected for 2008, 2013 and 2018. The average voter turnout across the three elections is then calculated for the 28 constituencies.
- BBMP election turnouts: The election results for the 198 wards of BBMP were collected for the 2010 and 2015 BBMP council elections. The wards were aggregated under the assembly constituency they belong to, and the average voter turnouts for BBMP elections were calculated at assembly constituency level.
Caveat: Since Anekal does not fall under BBMP limits, there was no ranking assigned to Anekal. - Ward committee meetings: The number of ward committee meetings held in the 198 wards was aggregated at the constituency level. This number is based on the number of “meeting proceedings” available for wards on the BBMP site.
Caveat: Ward committee meetings for Subhash nagar and Chalavadipalya wards are not available on BBMP’s site. It is possible that some reporting of these meetings on their site is completely missed out or delayed. - Fix My Street Data: From the BBMP ArcGIS server, 17,000 pothole reports from the Fix My Street app were scraped for the months of May and June 2022. Each complaint mentions the ward, and the complaints were aggregated at the assembly constituency level. With this, each Assembly Constituency has a count for the number of reports made on the Fix My Street app. A higher number of reports corresponds to more engagement with the civic authorities and so, Assembly Constituencies with more reports are given better ranks. The highest ranked Assembly Constituency, in this metric, is the one with the most reports on the Fix My Street app.
Caveat: Given that the data is reported by citizens through an app, areas with lower income and less tech-literate populations are likely to be underrepresented. - GPMS Data: Similar to Fix My Street, data from GPMS (around 60,000 complaints) is at ward level and is then aggregated at assembly constituency level. Constituencies are ranked higher if they have more grievance reports.
- I Change My City Data: Similar to Fix My Street, data is originally at ward level and is then aggregated to constituency level. Constituencies are ranked higher if they have more reports on I Change My City. The data is from the period 2019 to 2022.
Categorising the data
The data collected with the above methodology fall under two main categories:
- Voting and Active Participation: This category includes Assembly and BBMP election turnouts, and ward committee meetings. These data points are clearer indicators of citizens being more active in terms of participation, both in elections and working with local authorities to get issues resolved.
- Reporting Issues through Technology: This category includes GPMS, I Change My City and Fix My Street. These data points are less clear indicators of civic participation, though they still indicate citizens are reporting and engaging with the government in some capacity. However, given that these reports are made through apps or websites they are not easily accessible to lower income and less tech literate groups, who are more likely to report issues directly through their local government officials and are unlikely to appear in the data here.
Rating framework
With the above data and methodology, we developed a Civic Participation ranking framework for Assembly Constituencies based on the following individual metrics:
- Assembly elections voter turnout (higher is better)
- BBMP elections voter turnout (higher is better)
- Ward committee meetings held (higher is better)
- Pothole reports on Fix My Street (FMS) app (higher is better)
- Grievance reports on GPMS (higher is better)
- Reports on I Change My City(ICMC) (higher is better)
Assembly constituencies are ranked based on the above metrics, and the final score for an assembly constituency is calculated as follows:
Assembly Constituency Score = (3 * Ward Committee Rank) + (2 * Assembly Election Rank) + (2 * BBMP Election Rank) + GPMS Rank + ICMC Rank + FMS Rank.
A higher weightage is given to active ward committees and higher voter turnouts. A constituency with very high grievance reporting, but poor electoral turnout and ward committee participation would end up ranking lower than a similar constituency which performed better in election turnout and ward committee meetings.
Based on the ranking for each individual metric, the assembly constituencies are categorised as “HIGH”, “MEDIUM” and “LOW”, in terms of people’s participation in governance, as follows:
- Top 8 in a category are “HIGH”
- Bottom 8 in a category are “LOW”
- Remaining constituencies are “MEDIUM”
With this, each constituency has a ranking category for each metric. Additionally, a similar category is assigned to the constituency based on its total rank.
Read more: The great election inauguration: State govt capitalises on unfinished, poorly done projects
Results
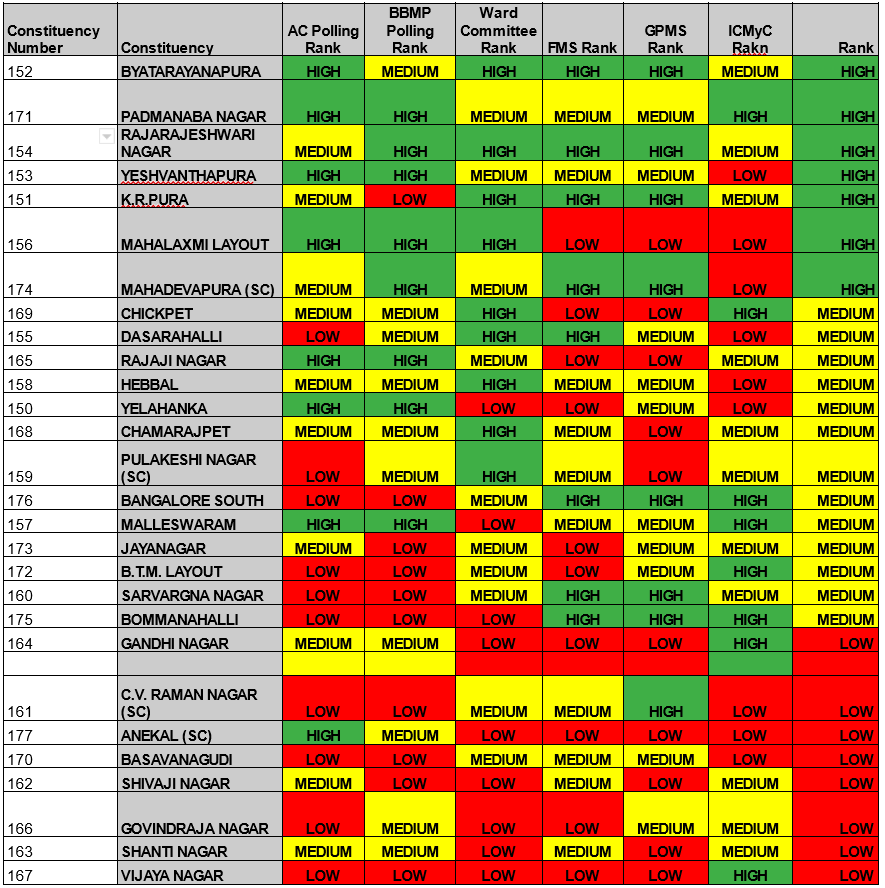
With the above formula, we obtained the final rating of Assembly Constituencies with respect to civic participation.


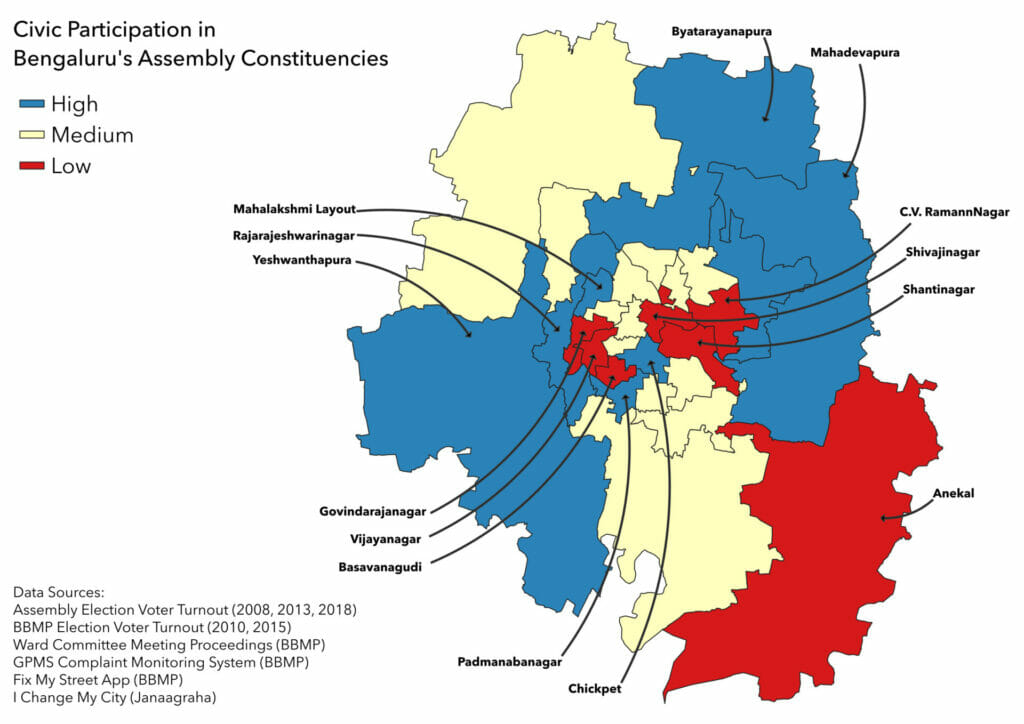
From the map, it can be seen that the regions towards the periphery of BBMP municipal limits tend to have higher overall civic participation. The areas in the outskirts of Bengaluru Urban district, consistently have the highest voter turnouts (Yeshwantpura, Yelahanka). However, some of these areas that lie outside BBMP (most of Anekal and Yelahanka) do not have ward committees, which bring down their final ranking with this methodology.
Constituencies around the tech clusters (Mahadevapura, Byatarayanapura), have more grievances reported on online platforms. There are constituencies in the centre of the city (Govindarajanagar, Basavangudi, Shivajinagar), that have neither high voter turnouts nor high levels of grievance reporting on the online platforms. Overall, the peri-urban and newly developed areas of the city that are within BBMP limits have the highest levels of civic participation.