This election season, Citizen Matters Chennai conducted a survey to analyse the state of the affairs in various neighborhoods of Greater Chennai Corporation (GCC), which has thrown light on some interesting facts about the residents’ perception of local governance.
The survey conducted by AskByPoll for Citizen Matters, was to understand the view of Chennaiites on public policy, local body representatives, quality of local governance, performance of MLAs, and important civic issues.
Over 100 respondents from different parts of Chennai took part in the survey, out of which 15 percent were from the extended areas of the GCC. Around 68 percent of the participants were males and 31 percent females in the survey conducted using an online questionnaire posted on our website.
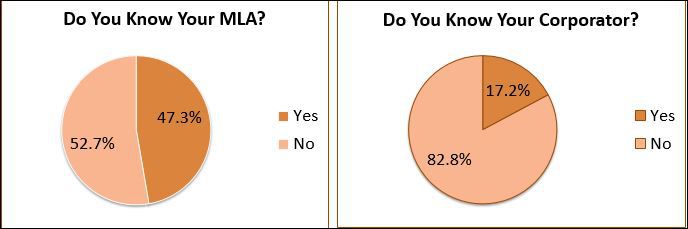
Shockingly, over 52 percent of the respondents did not know who their MLAs are, while around 82 percent had no idea about their Municipal councillor!
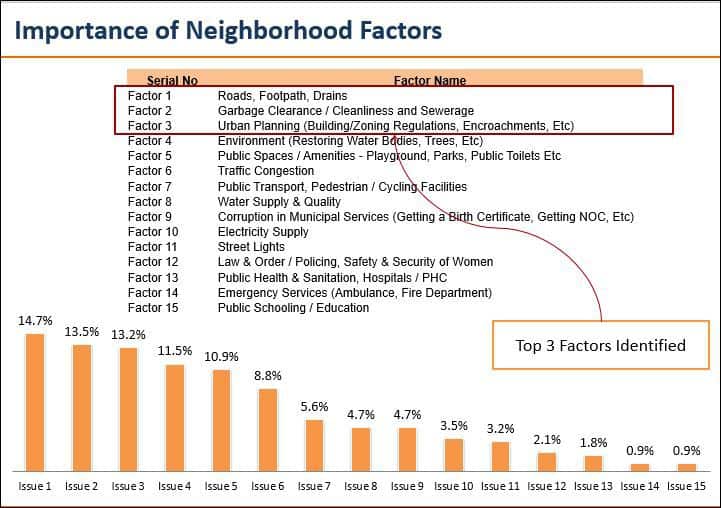
Neighborhood factors
Maintenance of roads, foot paths, and drains (14.7 %) is the most important factor according to the participants. Garbage and sewage disposal/cleanliness (13.5%) ranks second among the ‘neighbourhood factors’, while urban planning which includes building/zoning regulations, encroachments etc. (13.2%) is the third key factor.
However, when asked to rate the performance of their local bodies in addressing civic issues, electricity supply received the highest ranking of 3.23 on a scale of five, while law and order/ safety and security of women received 3.12. Emergency services (ambulance services, Fire Department) which ranks 3.10 and street lights (3.04) show better performance when compared to public schooling (2.91), public health and sanitation (2.74), and water supply and quality (2.71),
The GCC’s performance is poor in environmental conservation, waste management, and cleanliness, the survey says. Environment has the lowest ranking of 2.16, whereas garbage and sewage disposal, and cleanliness is rated at 2. 19. At the same time, corruption in municipal services ( issuing birth certificate, NOC, etc.) is given the rating of 2.48.
| Neighborhood Factors | Average Rating on a Scale of 5 |
| Electricity Supply | 3.23 |
| Law & Order / Policing, Safety & Security of Women | 3.12 |
| Emergency Services (Ambulance, Fire Department) | 3.10 |
| Street Lights | 3.04 |
| Public Schooling / Education | 2.91 |
| Public Health & Sanitation, Hospitals / PHC | 2.74 |
| Water Supply & Quality | 2.71 |
| Corruption in Municipal Services (Getting a Birth Certificate, Getting NOC, Etc) | 2.48 |
| Roads, Footpath, Drains | 2.32 |
| Public Transport, Pedestrian / Cycling Facilities | 2.29 |
| Traffic Congestion | 2.29 |
| Urban Planning (Building/Zoning Regulations, Encroachments, Etc) | 2.26 |
| Garbage Clearance / Cleanliness and Sewerage | 2.19 |
| Environment (Restoring Water Bodies, Trees, Etc) | 2.16 |
| Public Spaces / Amenities – Playground, Parks, Public Toilets Etc | a2.22 |
Local governance
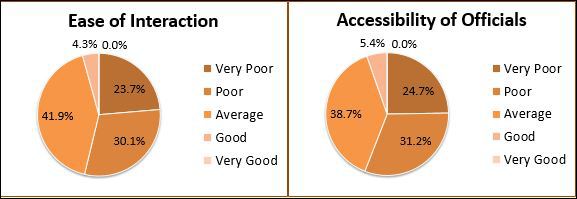 Government offices seem to be inaccessible to majority (53.7%) of the residents of the city. Around 40 percent of the participants says that the ease of interaction is ‘average’, around 30 says it is ‘poor’; whereas over 23 percent thinks that it is extremely difficult to interact with government officials. A minority of 4.3 percent respondents feel that the ease of interaction is ‘good’. Over 38 percent rates the accessibility of officials as ‘average’, 31.2 percent as ‘poor’, while 24.7 percent says it is ‘very poor’. At the same time, over five percent feels it is good.
Majority of the residents (60.2% ) are unhappy about the corruption level in local governance. Around 29 percent says that the corruption levels are high, while 31.2 percent who thinks it is even worse. At the same time, 32.3 percent thinks that the corruption levels are on an ‘average’; 5.4 percent thinks it is ‘low’, and 2.2 percent are satisfied enough to rate it ‘very low’.
Elections
Majority of the participants had voted in the 2011 elections, while 20.4 percent could not vote because their name was not on the Voters’ List. Over 63 percent said they had voted in the elections which resonates with the Election Commission’s data that 73.76 percent votes were polled in Tamil Nadu in the 2016 Assembly Elections. Over one percent of voters did not vote because they were unhappy with the choice of candidates. An important finding is that 3.2 percent did not vote because they were not interested, while 11.8 percent picked ‘Other reasons’ for not voting.
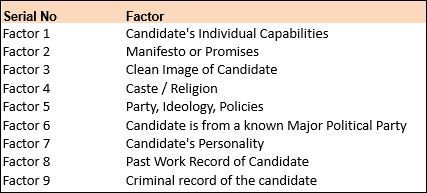
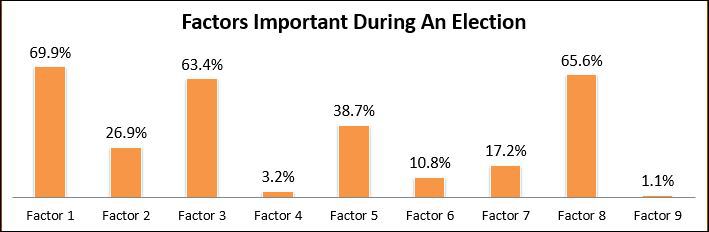
Majority of the residents gives importance to the candidates’ individual capabilities (69.9%) when making their electoral choice, and over 65 percent of the participants look for the past work record of the candidates. But a conflicting finding that while over 63 percent of the respondents said they would look for a candidate with a ‘clean image’, only 1.1 percent gave careful consideration to the criminal record of the candidates.
As per the self-perception of the participants, 52.7 percent are active citizens while around 47.3 percent says they are not active.
The MLAs and corporators could perhaps take a lesson out of the citizens’ responses, and find more time to interact with the citizens they represent which would help understand their demands and needs. The results suggest that the government should also take steps to make government offices more accessible and free of corruption. At the same time, the survey suggests that Chennai needs more active citizens to interact with local representatives and raise issues in their neighborhoods.