In December 2023, many parts of Chennai received record-breaking rains for two days. Though the event of cyclone occurrence was the same throughout the city, the capacity to recover from the aftermath was not the same for all. Experts say the reasons for this recovery variability could be attributed to infrastructure resilience such as sewage treatment capacity, water supply, water holding capacity of reservoirs and waterbodies encroachment.
These physical parameters are intensified by the socio-economic status such as the livelihood, income levels, social status of people and assets across different parts of Chennai. Here, it is important to look at the ‘vulnerability’ component to evaluate the susceptibility of people and assets to the sudden onset of extreme flood events.
At the Datajam organised by OpenCity on January 6, our team comprising of me (Snowy), Ganesh, Maharajan, Sachin, Sricharan and Vinita tried to understand the economic and social vulnerability in flood-affected areas in Chennai. We analysed data on tax-paying capacity, water supply deficit, presence of informal settlements and capital expenditure by GCC to understand the socio-economic demographic of Chennai.
Read more: Marooned and abandoned: Study reveals displaced families were put in the path of floods
Why Chennai floods?
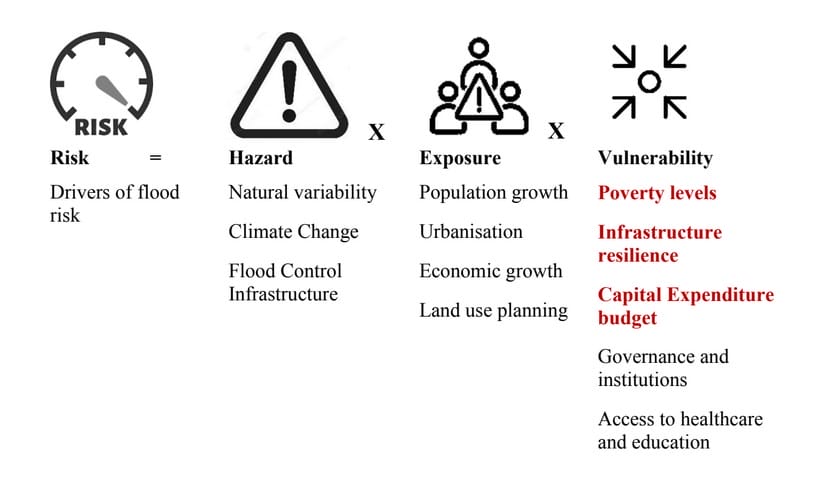
The drivers associated with flood risks are a product of three components: hazard (potential threat in terms of flood severity), exposure (people and assets in flood-affected areas) and vulnerability (susceptibility of affected people and assets in flood-prone areas).
Experts say in the last 50 years, Chennai has faced at least one flood every 10 years. But that interval has been narrowing since 2000, as the city has experienced floods in 2005, 2015 and 2023 due to climate change and natural variability reasons. The hazard is compounded by diluted rules and the conversion of water bodies to patta lands due to encroachments and unplanned urbanisation. The figure below highlights the drivers of flood risk.
Now that climate change and unplanned urbanisation have a direct relation with increasing flood risk, does the risk or disaster affect all strata of society equally?
Disasters don’t affect all equally; while the privileged move into hotels or pump water out of their living rooms, the poor are stranded or packed into relief camps with little to no basic facilities. During the 2023 floods, more than 1,000 people were escorted using boats in the southern localities of Pallikaranai, Perungudi and Sholinganallur while in North Chennai, an oil spill occurred just after heavy rains inundated homes, affecting the health and livelihood of residents. With flood water receding across all areas of Chennai, the recovery/resilience capacity of North is comparatively less than its counterparts.
Though unplanned urbanisation is observed across Chennai, the south and central parts get parks and walking paths as complementary to Metro Rail works/development projects. In contrast, the north gets coal stacking yards, thermal power plants and chemical refineries, increasing industrial pollution.
The ongoing pollution in North Chennai is not merely accidental, but rather, takes advantage of the socio-economic status of the oppressed. Extending from the Manali marshlands to the Ennore backwater, this area hosts 3,300 MW thermal power plants, a 10.5 million tonnes/year petroleum refinery, petrochemical and plastic factories, and the city’s largest garbage dump.
This unplanned urbanisation compounded with climate change events has a disastrous impact on social conditions by affecting fishing and other informal work sectors. For instance, at times of heavy rains, fisherfolk in North Chennai lose at least 5-7 days of their sea contact. This, in addition to industrial disasters, adds ‘oil to fire’, worsening their safe living conditions.
In this article, using available data on the Smart Cities portal and Greater Chennai Corporation (GCC) website, we drew insights on the economic and social vulnerability of flood-affected areas along the following axes: poverty levels, infrastructure resilience and capital expenditure.
Snapshot of informal settlement and infrastructure resilience
In Figure 1, the map captures the informal settlement density across Chennai. This shows the North
zones clustered with more informal or slum settlements followed by the Central and South zones.
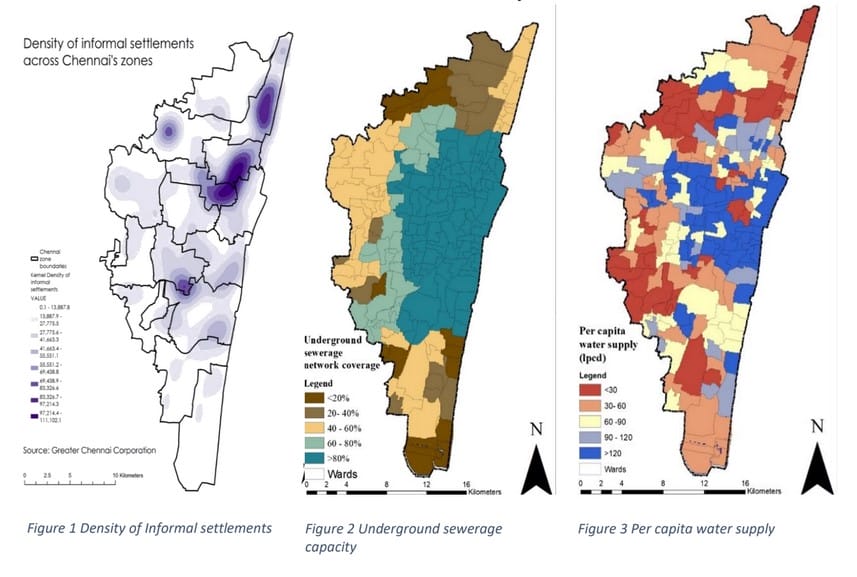
Figures 2 and 3 show the infrastructure resilience of zones such as the water supply capacity and sewerage treatment across all wards. In Figure 2, the North and South zones grapple with less than 20% of wards having wastewater management infrastructure. Very low sewerage network coverage is observed in 11.20% of the wards resulting in low water resilience because of the reduced sewerage water collected for treatment.
Figure 3 shows that the per capita water supply is not met in the North and South Zone whereas the Central zones have relatively better per capita water index. Though people in South have the financial access to water lorries, this adds a burden to the North given their economic status.
Looking into informal settlements and infrastructure resilience data, it is important to analyse the government spending on wards to understand the governance mechanism, resource utilisation and socio-economic upliftment or recovery at times of extreme climate events.
Does capital expenditure spending on wards translate to good water-resilient infrastructure facilities?
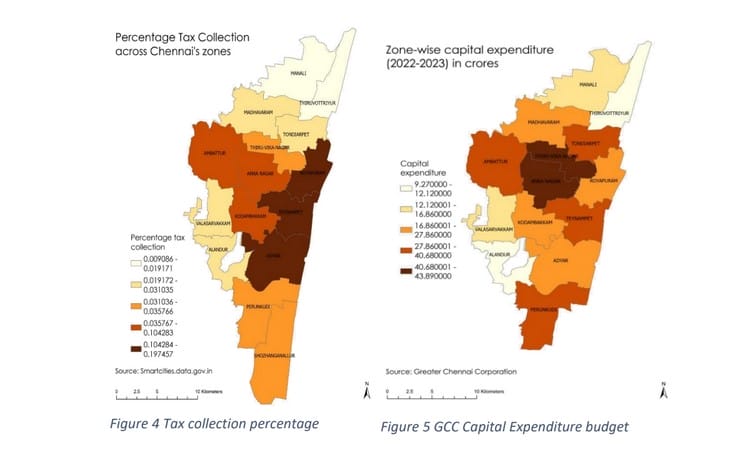
Figure 4 shows that GCC zones with more informal settlements have less property tax collections indicating lower income demographics. The capital expenditure budget Figure 5, spent on zone 1 and zone 2 (North) are the areas that still suffer from basic unmet needs like per capita water supply and wastewater management facilities.
Poorer zones tend to have worse infrastructure, weaker governance, lesser capital expenditure resources to spend on resilience and recovery and lower levels of access to social protection, water supply and drainage capacity, all of which contribute to less favourable outcomes in a flood event. For instance, in North Chennai, flood risk is greatest in socio-economically disadvantaged areas, because of lesser government spending.
Correspondingly, the spending from GCC did not match the need, tending to be in areas that were already paying more taxes except in the case of Thiru Vi Ka Nagar.
Read more: How Chitlapakkam remained flood-free during the recent Chennai rains
Way forward
GCC has a key role in prioritising flood mitigation infrastructure facilities of socio-economically disadvantaged zones. This shall be done by providing basic infrastructure needs such as increasing more than 80% of wards with per capita water supply and sewerage capacity.
Also, there exists a certain gap in the GCC tax collection to the spending capacity across wards, which needs to be rectified.
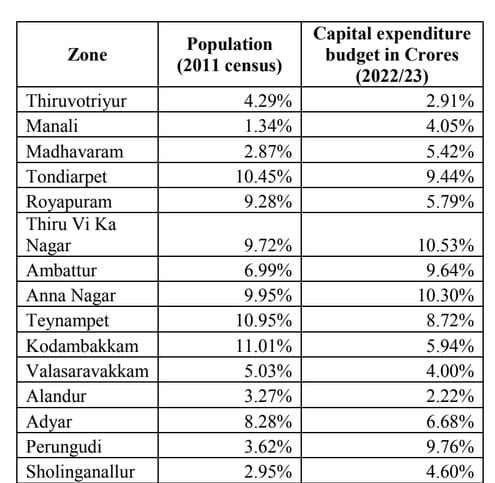
The GCC spending capacity on zones isn’t representative of population density as shown in Figure 6. Areas such as Manali, Madhavaram, Thiru Vi Ka Nagar, Ambattur, Anna Nagar, Perungudi and Sholinganallur had relatively higher per capita budget spending and the reasons could be attributed to industrial clusters, business development, IT corridors and Metro Rail development works in these areas.
Another constraint is the lack of zone-wise data on GCC capital expenditure spending on flood mitigation and adaptation measures. It would be useful to get flood mitigation and adaptation expenditure split zone-wise to better understand the utilisation of the budget corresponding to the population demographics.
Thus, accessibility to reliable budget data in the public domain could offer stakeholders an understanding of the infrastructure improvement and resilience facilities in socio-economically disadvantaged areas. Civic societies and government institutions must use this data and offer capacity to people to understand their needs, thereby improving flood resilience infrastructure across Chennai.
Going forward, budget allocation drafting needs a cross-institutional feedback mechanism from civic societies, councillors, residents, financial agents, CSR and government departments. The budget allocation must be representative of population demographics and vulnerability assessment of wards to capture the needs, recovery and resilience mechanism of the vulnerable population.