There is an emerging policy consensus around promoting cities as engines of economic growth (XV Finance Commission, 2020, pg. 169). NITI Aayog, in its May 2022 report, proposed developing comprehensive economic plans for Indian cities. The 74th amendment also allows Urban Local Bodies to integrate and implement economic development schemes through the master plan.
Cities across the world use economic data to understand and identify target areas for investment in transportation or economic infrastructure (for example, Sao Paulo) or setting up targeted investment funds (such as London’s Regeneration Fund and Growing Places Fund) or improving poor neighbourhoods’ access to better economic opportunities (Johannesburg).
However, at present, planning in Indian cities is limited to regulating land use and building plans due to various conflicts and challenges. One such challenge is the availability of economic data on a city-wide scale. In order to plan holistically, planners need better information about the economy and labour markets covering the entire city.
In the Indian context, data sets on output, firms and employment are either not collected or not made available at an adequate level to study economic differences across neighbourhoods in a city. As part of the PEAK Urban, a research project funded by UK Research and Innovation, focused on generating new research around the future of cities, we undertook research to address this data gap.
We present a case, using our work, for how having this granular spatial economic data helps us get a comprehensive understanding of the city’s economic geography. And why this is important for comprehensive economic planning focused on job creation and sustainable economic development.
Existing data landscape on urban economy and challenges
Currently, data on the economies of cities is fragmented across multiple data sources, such as the Annual Survey of Industries (ASI), Ministry of Corporate Affairs (MCA), National Sample Survey Organisation (NSSO), Periodic Labour Force Survey (PLFS), Centre for Monitoring Indian Economy (CMIE), etc. But these data sets have issues in the way it is released, including frequency, spatial granularity, and interoperability (its ability to be used along with other data sets).
Read more: Migrant workers deal with unhygienic living conditions, poor nutrition
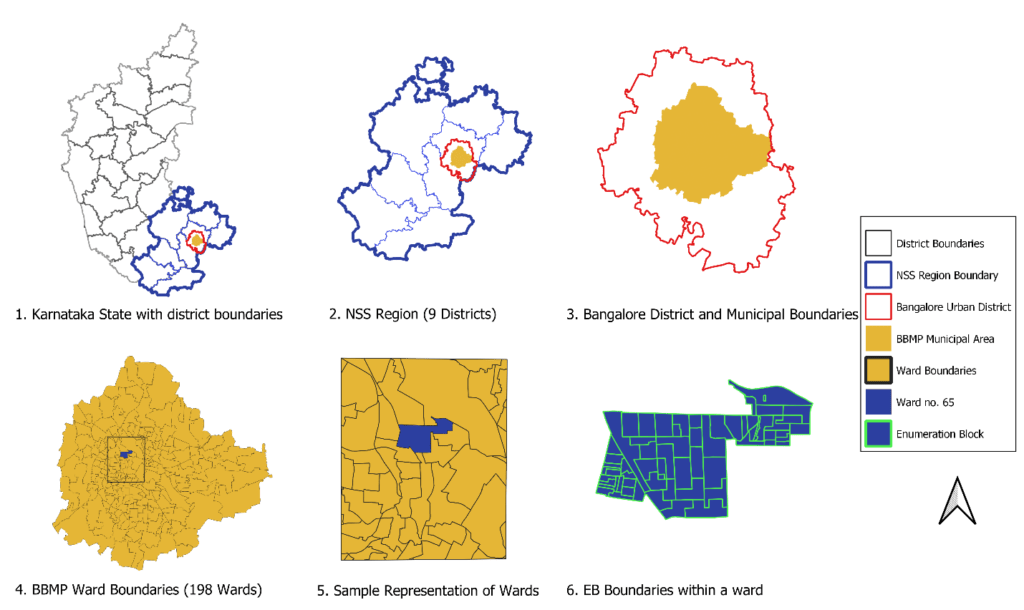
For example, survey data sets such as NSSO and PLFS, which are done more frequently, are only available at a Region Level (consisting of multiple districts; see 2 in image1) or higher (state or national level) whereas the population census releases sectoral employment only at the district level. Comparatively, the economic census releases data at enterprise level with the Enumeration Block (EB), [a smaller unit within the ward consisting of 100-125 households. A ward has multiple enumeration blocks within it] as a spatial identifier (see point 6 in Image below).
Since the vast majority (70-80%) of the urban workforce in India works in the informal economy and as self-employed workers, there is a need to capture labour market data from employment surveys in addition to data on formal firms. Another problem with these data sets is that they are often not released along with spatial identifiers, making it difficult to understand either firm geographies or labour geographies of the city. This limits the ability of planners and policy makers to prioritise investments in areas like infrastructure.
The Economic Census (EC) offers the potential to map the economy at a city scale as it enumerates all enterprises (except crop plantation, public administration, and defence) and collects information on both organised and unorganised/informal firms. This information is released at an Enumeration Block level, the smallest spatial unit for the census. However, the data set still has many gaps which need to be addressed.
According to our analysis for Bengaluru, the EC shows signs of both undercounting and incompleteness when compared with employment figures from the Population Census. We see that very large firms (>100 employees), especially for Knowledge Intensive Services (KIS) and manufacturing enterprises (especially readymade garments), are undercounted. As a state official involved with carrying out the Economic Census explained to us, enumerators are unable to access some of these spaces as many of these industries are located in large gated complexes.
In order to fill this gap, we used the Common Business Register (CBR), a data set on registered firms released by the Government of Karnataka, which has better coverage of large firms compared to the Economic Census and creates an integrated data set, hereby referred to as Comprehensive Economic Data set (CED).
Another challenge with using this data set is that while the Economic Census releases the data at the EB level, the EB boundaries are not available in the public domain for planners to conduct accurate analyses.
Mapping Bengaluru ’s Economy
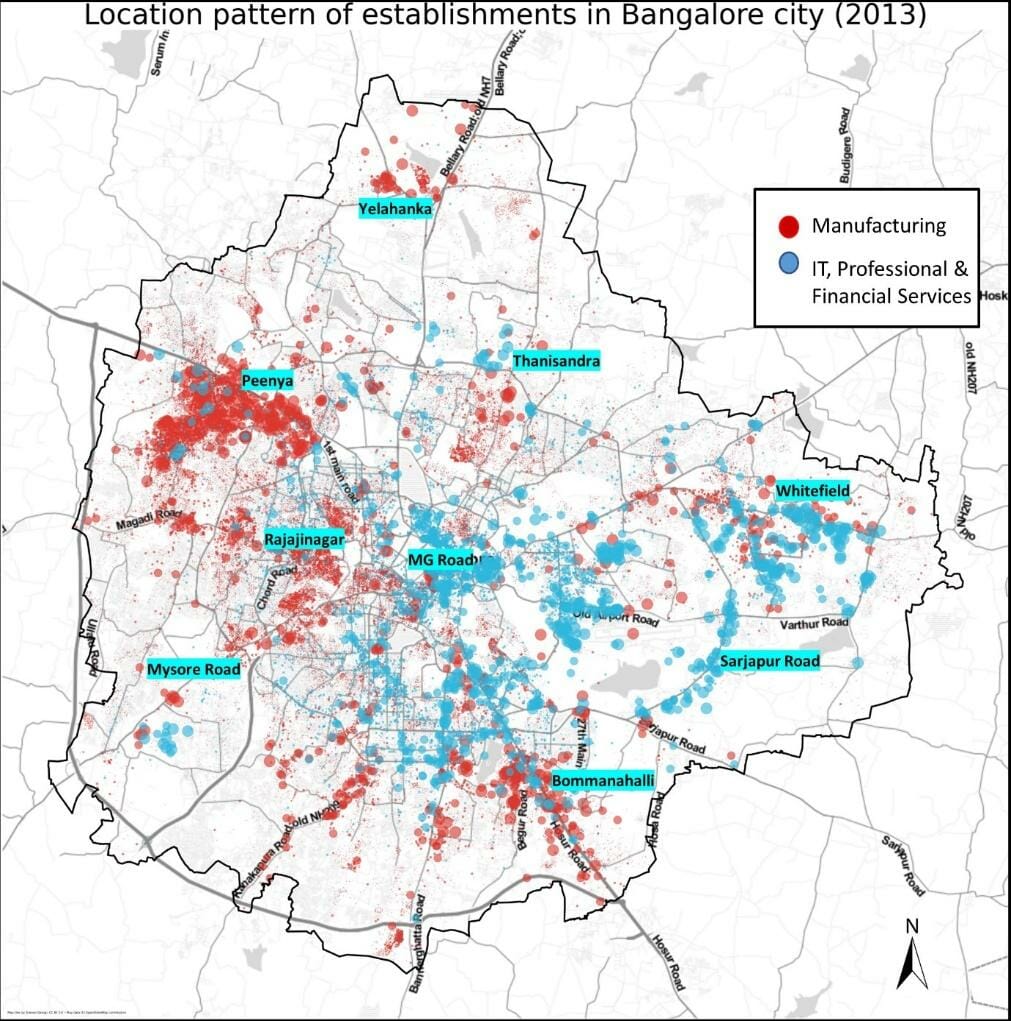
Method Used: Random uniform location of establishments within enumeration block. Point size is proportional to employee strength of the enterprise.A large employee enterprise will have a larger point size.
Data Source: Comprehensive Economic Data set, IIHS 2022
When we spatialise the CED, we see the employment geography of Bengaluru, which shows different spatial clustering patterns for different economic activities. As seen in Image1, manufacturing activities in the city are concentrated in the west and knowledge-intensive services, such as information technology, and professional and financial services, are located in the east.
Many of these industrial cluster locations are influenced by historic policy decisions. For instance, Peenya industrial area, which was planned and developed by the state in the 1970s in North-West Bengaluru, is still one of the largest industrial hubs in the state.
Similarly, the IT corridor expanded into South-East Bengaluru, partly due to the government setting up Electronics City in 1976, and later the Information Technology Park Limited in Whitefield in East Bengaluru (Heitzman, 2004; Nair, 2005) followed by the city planning authority actively promoting high-tech industries along the Outer Ring Road (ORR).
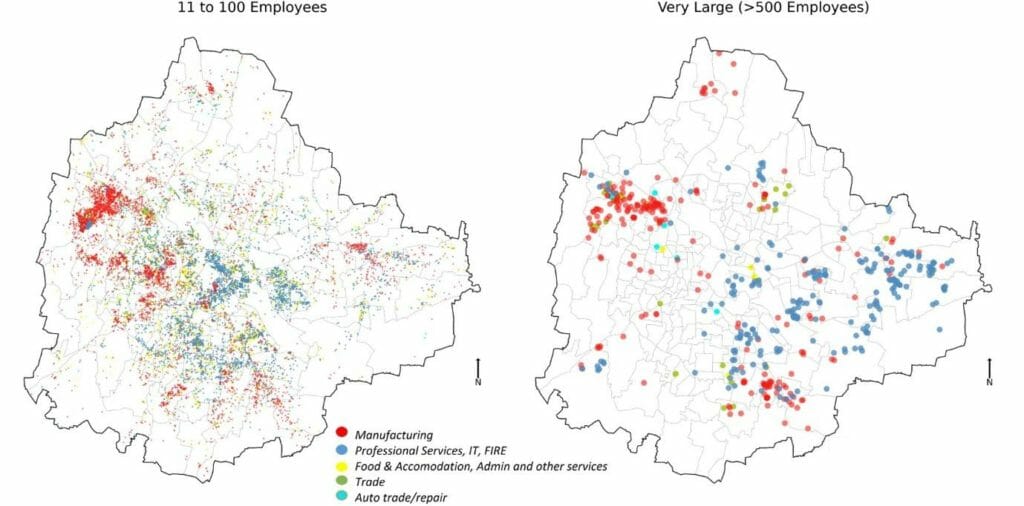
The city also has varying economic clusters based on the size of enterprises. As seen, in the image above, small-scale manufacturing is clustered around Peenya, Pete Areas, and Arterial Roads of Bengaluru, whereas small-scale KIS enterprises are more concentrated in the Central Business District area and South Bengaluru areas. Comparatively, Large Scale Manufacturing is mainly concentrated in Peenya and Bommanahalli – Hongasandra (where many large apparel manufacturing industries are located) while Large Scale KIS is concentrated along the ORR.
Planning and the Urban Economy
Firm locations are the result of various economic choices, including the cost of operations, availability of labour, infrastructure, proximity to clusters, etc. Seeing the city’s economy at a spatial scale helps planners identify areas of employment and better plan for infrastructure investment and support economic growth.
Our cities have very diverse economies, which have very different infrastructure and development requirements, to help them grow. For example, areas with knowledge-intensive services might have requirements for Grade A and Grade B buildings, IT parks, commercial/ recreational centres, etc., while a low-tech manufacturing cluster would require more focus on grade C buildings/warehouses with affordable rents, rental housing, and social infrastructure such as migration centres, Primary Healthcare Centres, etc.
Read more: Bengaluru’s Labour Stands present a highly exploitative and informal hiring market
Economic diversity is very crucial for sustainable growth and job creation. As such, planners need to have access to granular data, which can help them understand the economic geography of the city and help build local area plans suitable to the requirements of the local economy.
As data is increasingly becoming more integrated into planning decisions, it is important for planners to have access to timely data at fine-grain resolution with proper quality checks. The Economic Census offers a lot of potential to fill this gap in understanding the urban economy.
However, it needs investment in establishing data quality and making it accessible to the public along with spatial boundaries. By doing so, we enable our cities to be one step closer to better comprehensive economic planning and accelerate our country’s economic development.