While bird detection trends over the years clearly point to the decline of Bengaluru’s shoreline and vegetated-edge habitats, numbers alone tell only part of the story. In Part 3 of this four-part series on the state of the city’s waterbirds, we have used a scoring system to understand how stressed the lakes and the microhabitats within the lake are, based on the bird diversity they support. We explore how lake shape, permanent inundation and shifts in citizen-led management might explain why some lakes may thrive as wetlands while others collapse.
For instance, at Kasavanahalli, the Pied Kingfisher and the Coot are both declining at around 4% per year. The Coot has fallen from 89% detection to 64%, still one of the most-recorded birds on the lake. The Pied Kingfisher has fallen from 42% to 3%, from being an all-year resident to an occasional visitor. Even with comparable decline rates, the underlying ecological signals are vastly different. Hence, we have to consider the detection rates or the abundance of a species.
Structured ground surveys are the most reliable way of assessing waterbird abundance at a lake. However, since such surveys are rare, the detection rates in eBird checklists are a useful proxy to fill the gap.
The number of species supported by a microhabitat is another important ecological signal. For example, Lalbagh and Kalkere may have a similar mean trend score for shoreline birds, but Lalbagh supports only five shoreline birds compared to Kalkere’s 16.
To capture these, we introduced a State score based on species richness of a habitat within a lake and how often a species is spotted in the habitat. The State and Trend scores are then combined to arrive at the habitat score. The details of the calculation are provided here.
Microhabitats under threat: Winners and losers
Because migratory birds are seen less often every year than residents, we calculated the separate habitat scores for each group, before combining them to arrive at the final score. The analysis of the habitat scores calculated across the 14 lakes is summarised below:
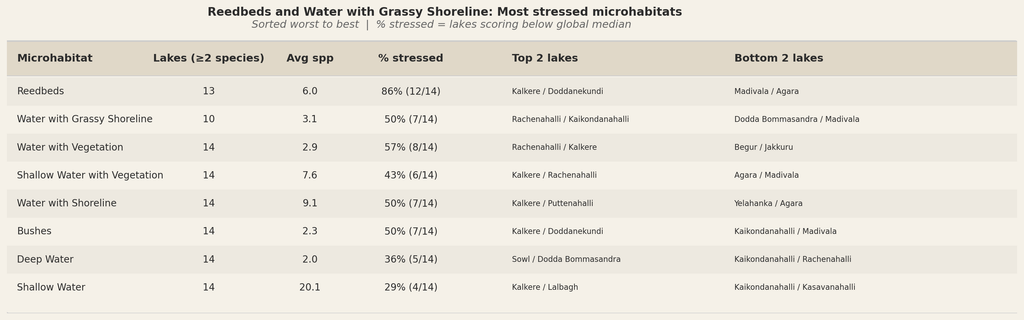
Shallow water and open water habitats are the least stressed microhabitats. At a typical lake, they support 67% of the resident waterbird species and account for almost 77% of resident waterbird detections. This is consistent with the bird-level trends from Part 2 of the series, where shallow- and open-water generalists dominated the winners.
Reedbeds emerge as the worst-performing microhabitat across lakes, indicating a structural loss. Grassy shorelines, too, are dwindling in most lakes. Transformation of lakes into bowls, desilting, and lake rejuvenation have all likely contributed to the loss of these microhabitats. Additionally, reeds and shoreline grasses are often classified as weeds since they look “messy.” They may therefore fall prey to beautification drives.
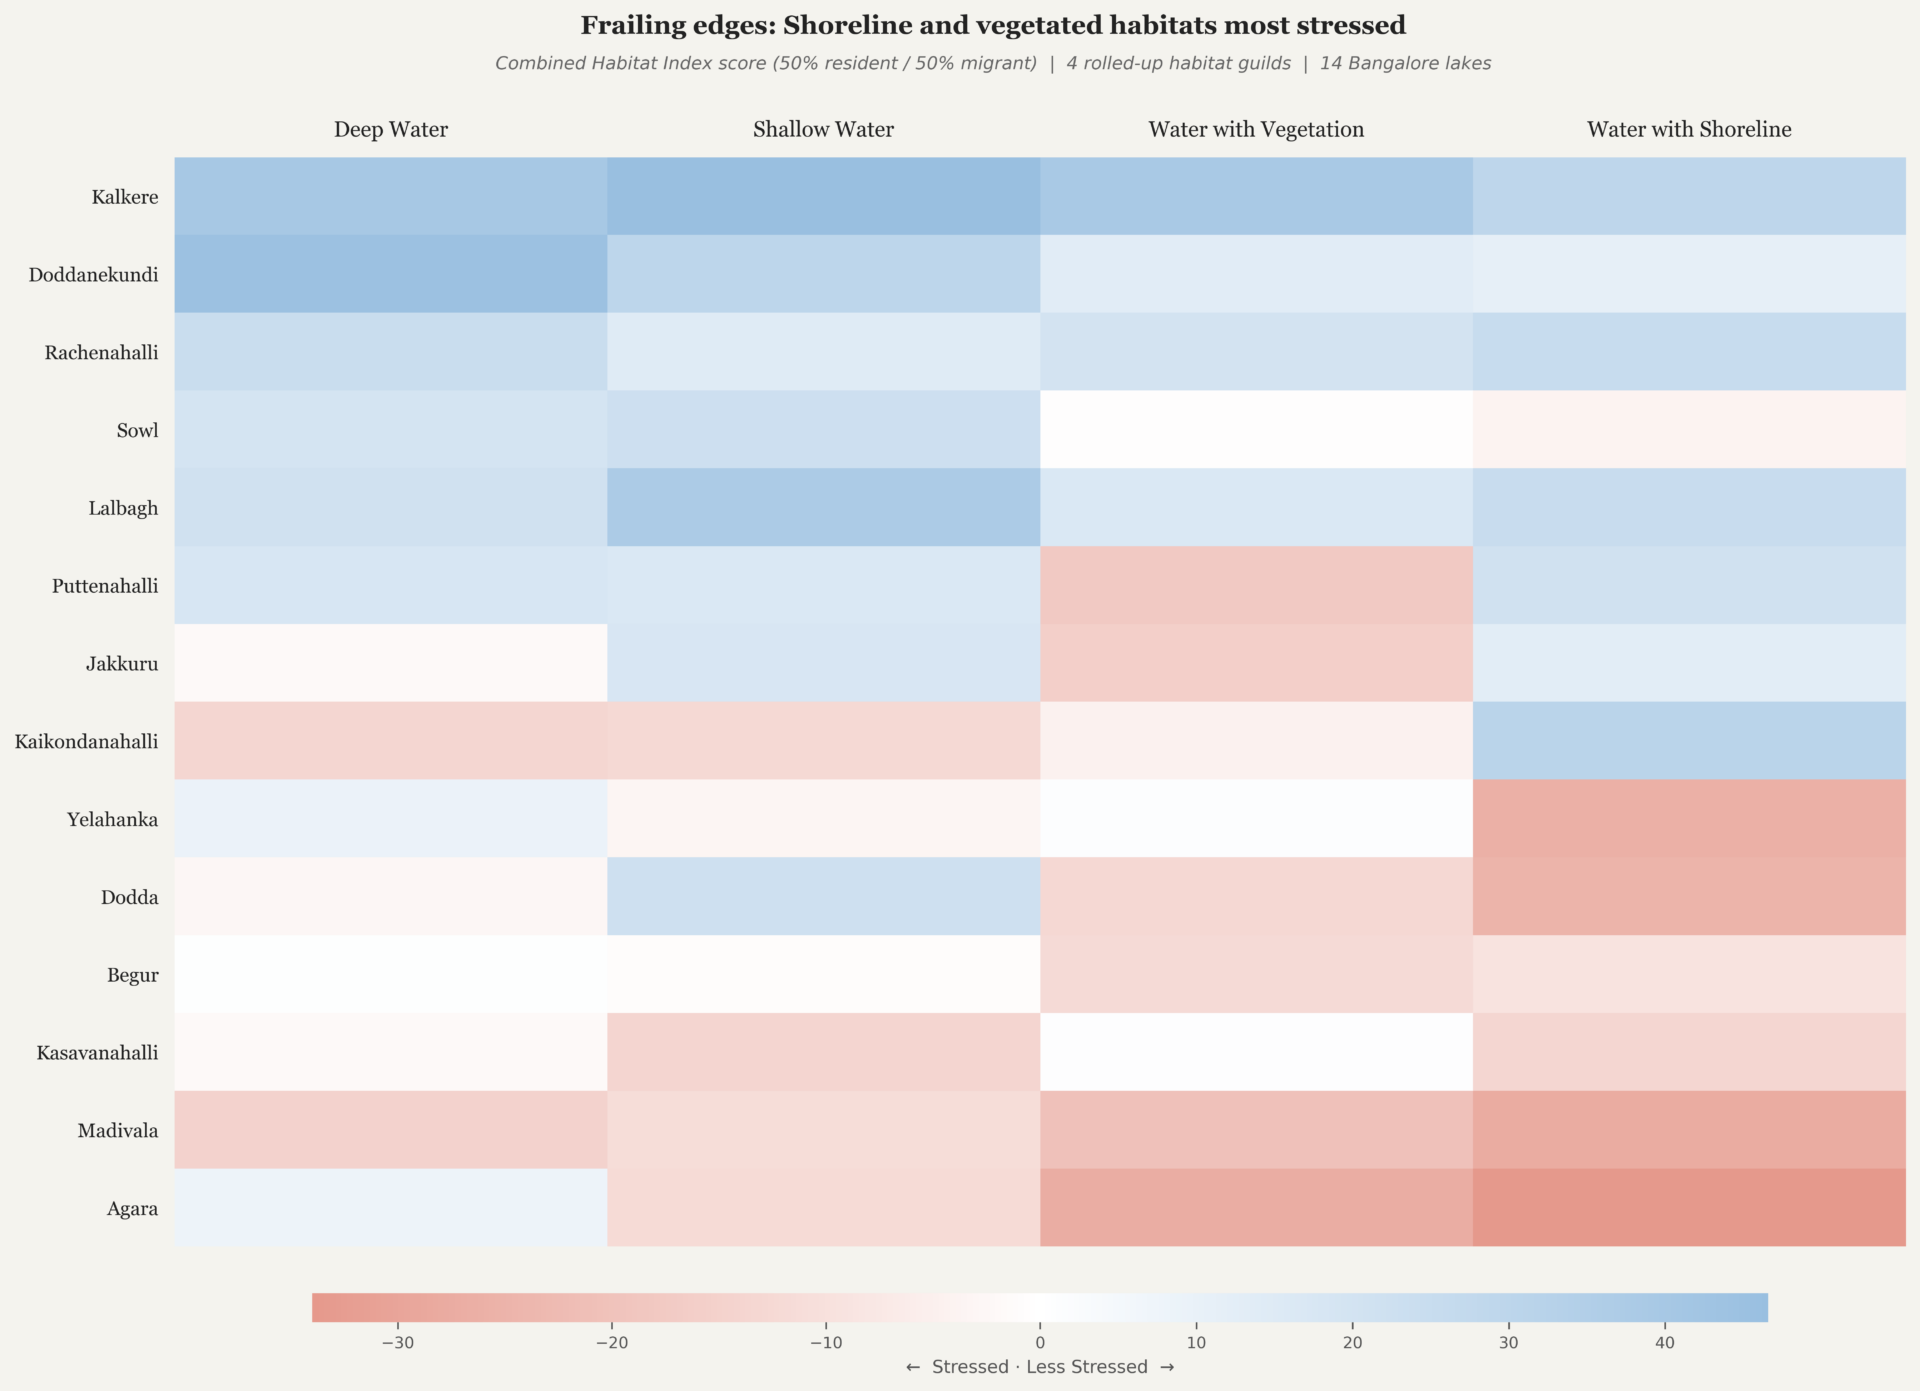
The visualisation below confirms that edge habitats are the most stressed across lakes. It also reveals lake-level signals. For instance, an all-round collapse is unfolding at Agara and Madivala, while Yelahanka and Sowl show a stressed shoreline.
Lake scorecards
Ultimately, we wanted to translate the trends, the state and the species richness into one simple, intuitive metric – a score that will help us answer: which lakes in the city have the best wetland habitats? Which lakes are the worst-performing?
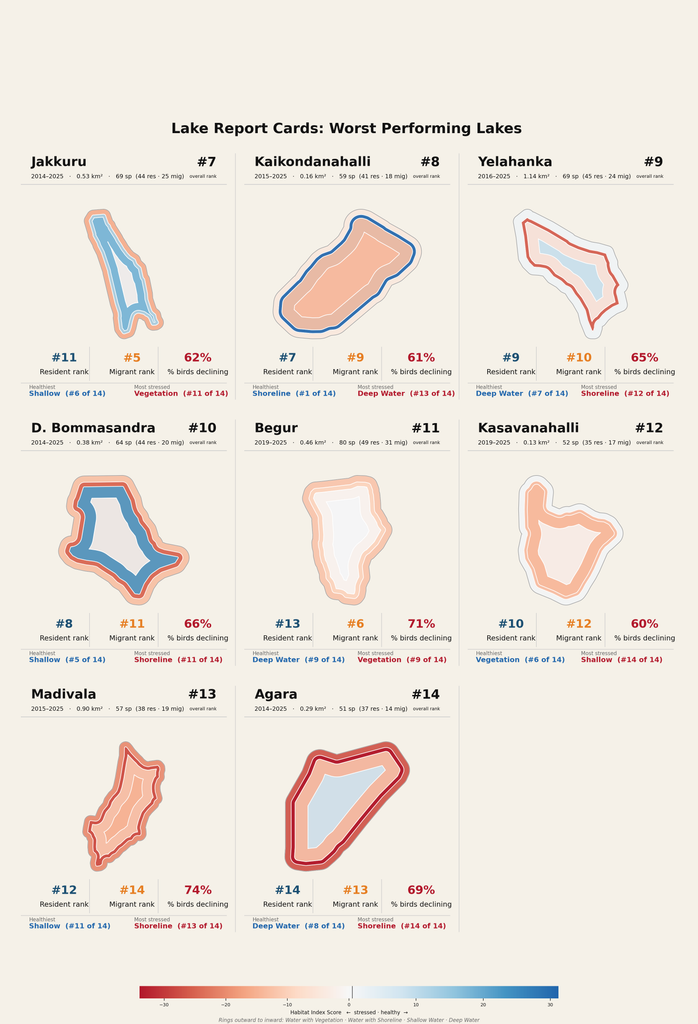
To answer this, we combined the habitat scores and species richness to arrive at a lake score. As with the habitat score, this was calculated separately for residents and migrants before consolidating the two into the final score. Details of the implementation are provided here. The results have been aggregated into report cards below:
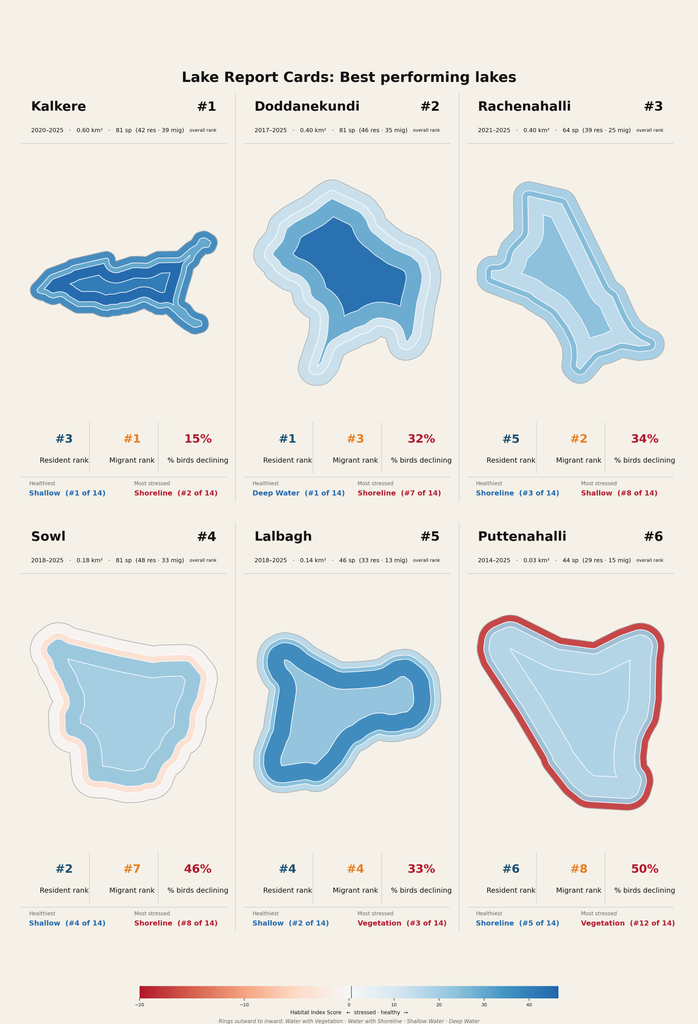
Three of the top-performing lakes – Kalkere, Doddanekundi and Sowl – support a richer diversity of waterbirds despite their smaller size.
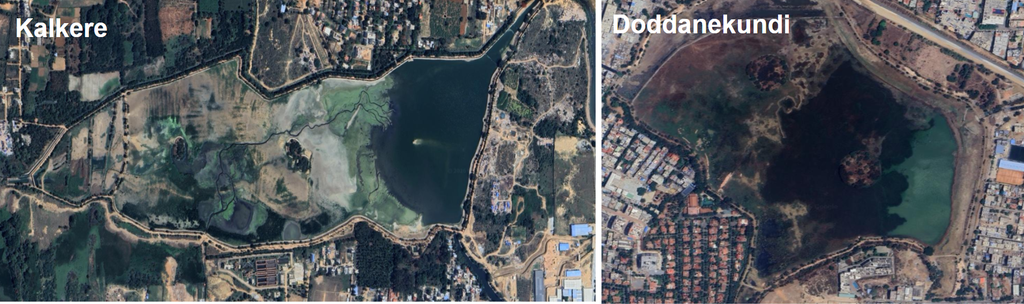
Analysing satellite imagery, we found that all three lakes dry out during parts of the year. The seasonal lake drawdown exposes mudflats and shallow margins, creating a mosaic of habitats especially critical for migrants. This could also explain why Doddanekundi and Kalkere rank as the best lakes for migrants in our analysis. Incidentally, all three are downstream lakes.
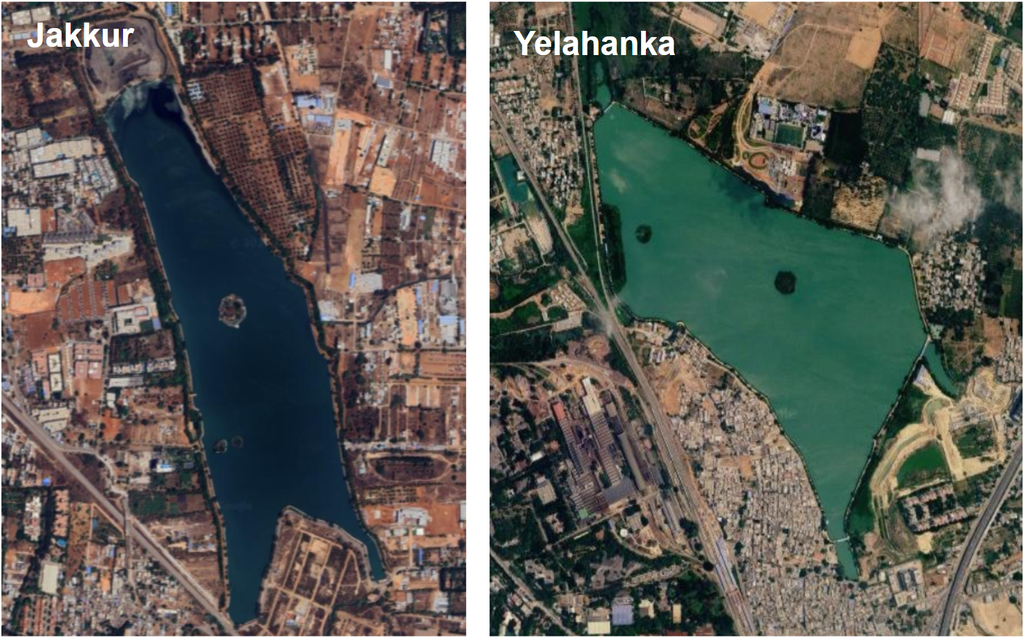
This is in contrast with lakes like Jakkur and Yelahanka, which are fed by STP-treated water and remain full through the year. This continuous inundation prevents the formation of shoreline habitats.
Read more: Bengaluru lakes can be maintained only with local community support: Usha Rajagopalan
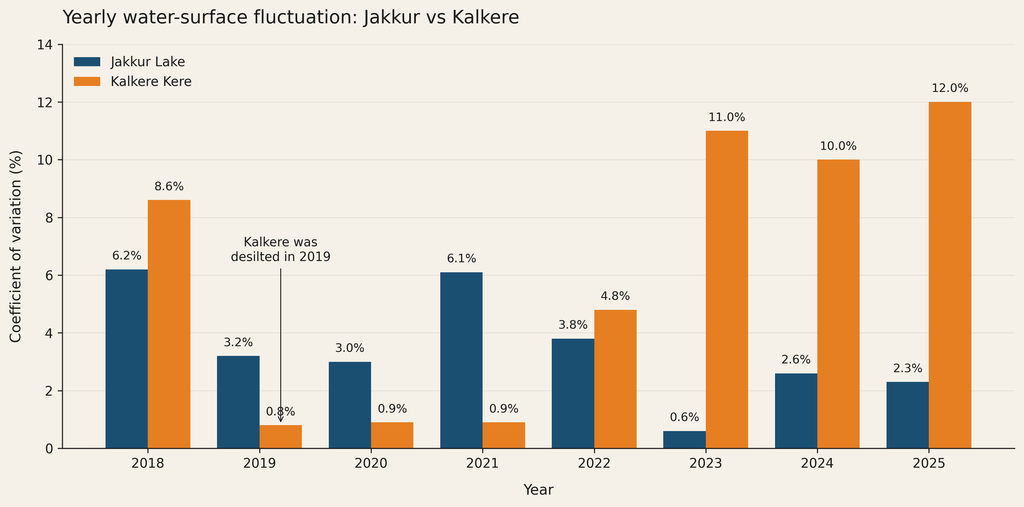
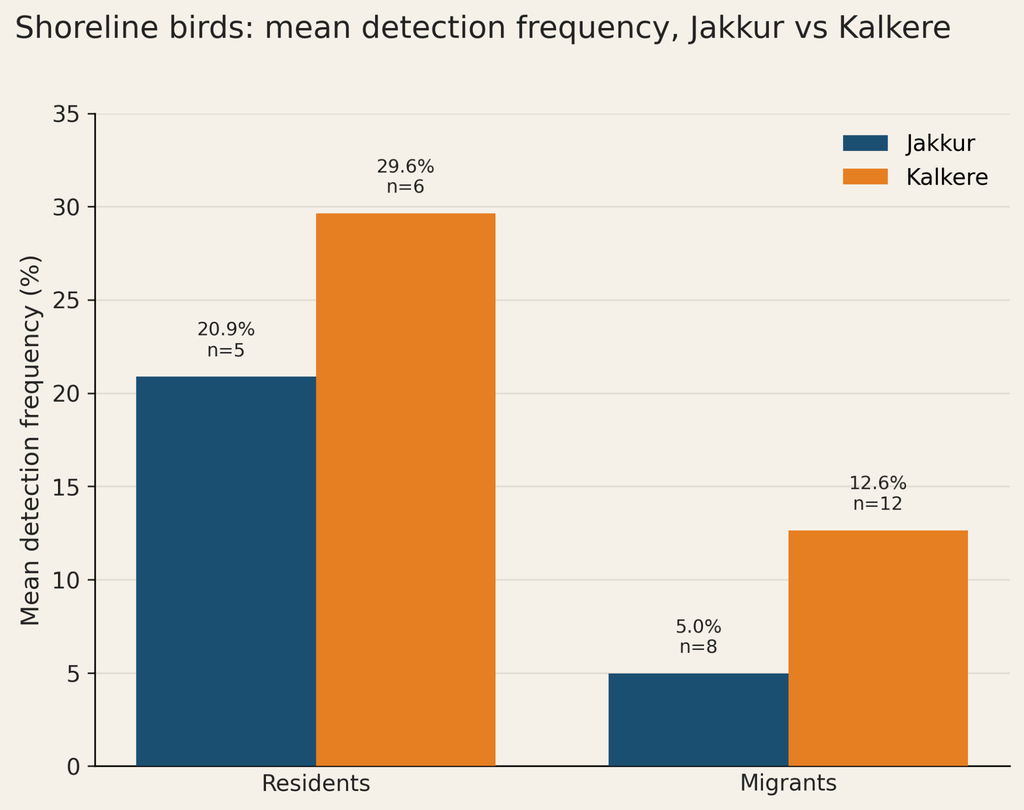
Kalkere was desilted around 2019, but the seasonal drawdowns reappear post 2021, possibly due to silt accumulation. In contrast, the fluctuations at Jakkur have stabilised at the lower level. This is reflected in the performance of shoreline birds at both lakes. Kalkere supports about 50% more shoreline migrants than Jakkur, and their likelihood of detection is two and half times higher.
More water does not mean healthier
The sight of a lake brimming with water throughout the year may please the human eye, but ecologically, a lake that goes dry for parts of the year is far healthier.
As we highlighted previously, the shape of a lake is a critical factor affecting its ecology. We recreated shape profiles for a few lakes using bathymetric survey data. The Jakkur and Rachenahalli data are from a field survey, while the Yelahanka numbers are sourced from a detailed project report (DPR). These are 2018 numbers and do not reflect siltation or any recent modifications to the lakebed (bathymetric data was shared by Rashmi Kulranjan, WELL Labs).
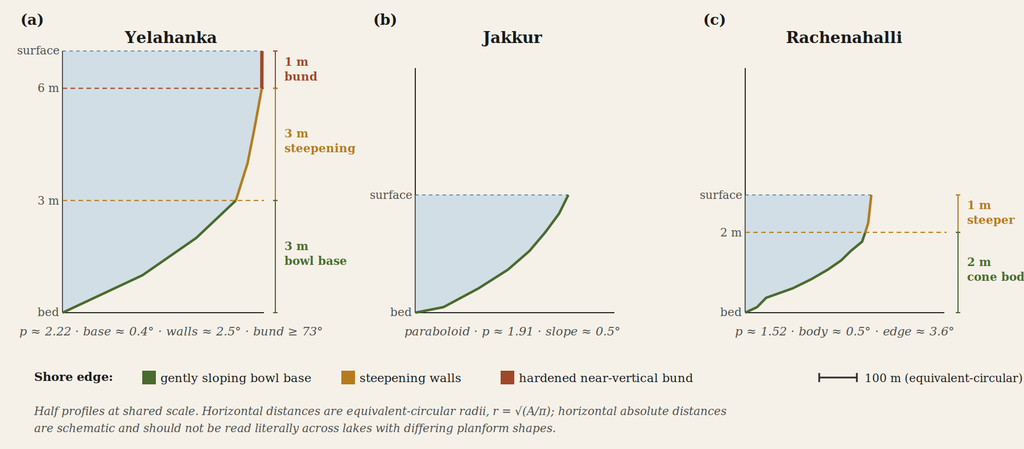
What the shape of a lake says about its health
The ecological costs are evident. 91% of shoreline birds have been lost or are in decline; 33% of the migrants have been lost. The shoreline guild is in steep decline in the largest lake in our study, a consequence of it being reshaped into a water-storing bowl.
A similar shoreline collapse is unfolding at Madivala, the second biggest lake in our study. Effectively, the two largest lakes in our study have been transformed into tanks and no longer function as wetlands. However, we could not access any bathymetric data for Madivala.
Rachenahalli, shaped like a cone with a gentle slope, retains the broadest shallow edge. Only one of its 12 shoreline species has been lost, the lowest among the lakes in our study group. However, with only five years of data, the long term trends are still playing out.
Lalbagh’s high ranking reflects a limitation of our methodology rather than its ecological health. With no seasonal drawdowns and the fewest migrants in our study, Lalbagh represents the quintessential urban tank. It ranks in the top six only because most of its remaining birds, primarily shallow-water residents, have a positive trend score.
Puttenahalli (JP Nagar) is the smallest lake (area of 0.03 km2) in our study. Yet it supports 44 species, 15 of which are migrants. The lake has lost all reedbed and grassy-shoreline specialists, and most of the remaining vegetated-edge-dependent birds are declining too. But its open-water residents are resilient, and the remaining shoreline birds are holding, pushing it into the top 6. While migrant detection rates are falling, it fares better than other South Bengaluru lakes like Agara.
Managing a lake against disrepair
Puttenahalli kere was the first lake to be handed over to a citizens’ group, the Puttenahalli Neighbourhood Lake Improvement Trust (PNLIT), for upkeep in 2011. Much of its revival in the past decade is owed to PNLIT’s stewardship. The lake’s maintenance was handed back to BBMP in July 2025 in compliance with a 2020 Karnataka High Court order that barred BBMP from entering MoUs with citizens’ groups.
Another lake that reverted to BBMP management in recent years is Kaikondranahalli. Managed by Mahadevapura Parisara Samrakshane Mattu Abhivrudhi Samiti (MAPSAS) since 2011, Kaikondranahalli too was a celebrated revival story. But the lake has seen a serious decline, with its open-water birds collapsing in particular.
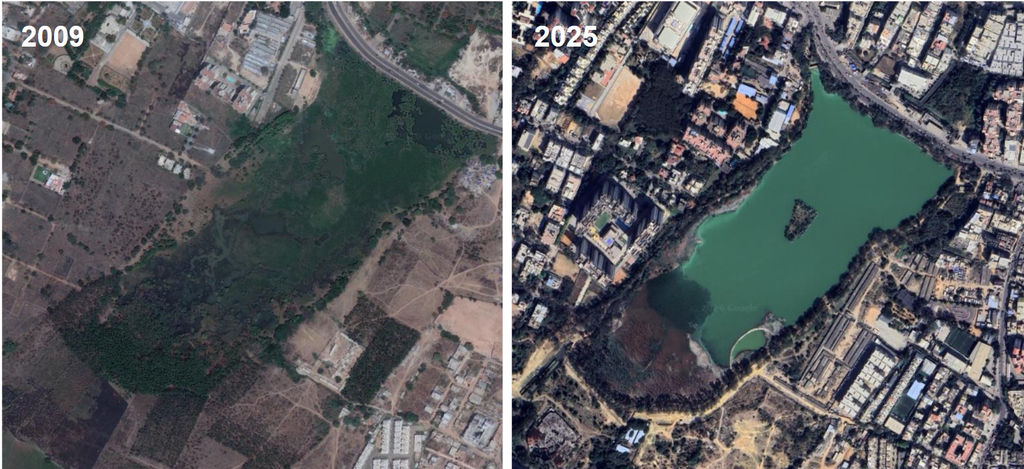
A recent report documented how the lake has fallen into disrepair since its management was handed back to BBMP in 2020-21. The unchecked flow of sewage is choking the lake, the roosting islands are in a bad state too. Our data bears out that the decline is recent. The improving detection rates for the deep-water guild seen between 2014-19 have been reversed.
Similar governance issues, combined with rampant wetland encroachment and untreated sewage inflow, are likely why 69% of waterbirds are declining in the neighbouring Kasavanahalli Lake. It ranks the lowest in our analysis.
Only Begur, a major lake in South Bengaluru, has a higher share of declining birds. To figure out the reasons for this collapse, one of our team members visited Begur Lake. The observations from the visit are documented in the next article, which is the final part of the four-part series.
The team would like to acknowledge:
- Rashmi Kulranjan, Hydrologist at WELL Labs , for sharing datasets related to cascade connectivity and pointing out the pertinent ecological issues associated with Bengaluru lakes today.
- Ashwin Viswanathan, Scientist at Nature Conservation Foundation , for advising us on waterbird guild classification and interpreting eBird data analysis results.