(In Part 1 of the series, data analysts explained how they arrived at a definition of water security and created a location-specific index. In Part 2, the analysts will explain the methodology used in estimating the use of the Cauvery index and how the results have been obtained)
The variables (below) were indexed and weighted with the Cauvery index, which was prioritised due to its significant impact on Bengaluru’s water security. Groundwater and land-use indices, being interdependent, received equal weights, followed by the governance index.
Here is a summary table:
| Parent Index | Variable | Weight Assigned |
| Cauvery | Cauvery supply to Ward | 1 |
| Groundwater | Borewell Water supply (litres/person/day) Ward area % covered by lakes/tanks Ground Water extraction Ground Water Quality | 0.3 |
| Land Use | Unbuilt area (lakes excluded) Commercial land area | 0.3 |
| Governance | BWSSB Helpline in ward | 0.2 |
For each ward, the net indices are multiplied by the corresponding weights. The product is then ranked in the ascending order of their values to arrive at the final index.
Read more: Water scarcity in Bengaluru: Drowning in problems, thirsting for solutions
Ward-level Cauvery supply estimation
Data from the 2017 Jica Report has been used to estimate supply of Cauvery water. Figure 3.2.15 from the report provides the location map of subdivisions.

The supply volumes for the divisions are available in Table 3.2.22 of the report, which has been reproduced below:
| Subdivision | Receipt (ML) | Billed (ML) | Leakage loss |
| C1 | 1207 | 565 | 53% |
| C2 | 882 | 616 | 30% |
| C3 | 1124 | 618 | 45% |
| NE1 | 1421 | 915 | 36% |
| NE2 | 643 | 457 | 29% |
| NE3 | 1308 | 726 | 44% |
| N1 | 744 | 519 | 30% |
| N2 | 838 | 436 | 48% |
| N3 | 941 | 516 | 45% |
| NW1 | 1477 | 874 | 41% |
| NW2 | 1168 | 794 | 32% |
| NW3 | 1046 | 722 | 31% |
| NW4 | 18 | 14 | 22% |
| W1 | 831 | 491 | 41% |
| W2 | 1822 | 1191 | 35% |
| W3 | 495 | 409 | 17% |
| SW1 | 1614 | 580 | 64% |
| SW2 | 1250 | 805 | 36% |
| SW3 | 1221 | 709 | 42% |
| SW4 | 1880 | 1015 | 46% |
| S1 | 1016 | 764 | 25% |
| S2 | 1309 | 992 | 24% |
| S3 | 1169 | 635 | 46% |
| S4 | 1234 | 813 | 34% |
| E1 | 963 | 618 | 36% |
| E2 | 854 | 517 | 39% |
| E3 | 744 | 411 | 45% |
| E4 | 651 | 353 | 46% |
| SE1 | 1840 | 1192 | 35% |
| SE2 | 1417 | 844 | 40% |
| SE3 | 911 | 524 | 42% |
The billed volumes were considered in our analysis as this also accounts for losses due to leakage. The Cauvery supply volumes data was then calculated in the following steps:
- The current BWSSB divisions were aligned with the 2017 JICA report subdivisions.
- Population of each ward was multiplied with the area of the ward to arrive at the area contribution of each ward to a BWSSB subdivision. Water sharing within the division was based on this population contribution from each ward.
- This computation was done for all subdivisions and the water allocation was summed up for every ward to arrive at the ward-level supply.
- Finally, the ward-level supply was normalised with the ward population to arrive at the water supplied in terms of litres per person per day at ward-level.
Results
Population data, water supply/volumes for each subdivision were determined using Opencity BWSSB dataset and 2017 JICA report, which was plotted in a heat map.
A tabulation of the top 10 and the bottom 10 wards in terms of per-capita Cauvery supply is provided below:
- Ward with the highest per capita Cauvery supply is ranked 1
- The ward with the lowest per capita Cauvery supply is ranked 225
| Ward # | Ward Name | Water allocation (l/p/d) | Rank |
| 119 | Shivaji Nagar | 191 | 1 |
| 120 | Bharathi Nagar | 191 | 2 |
| 167 | Ashok Nagar | 183 | 3 |
| 121 | Ulsoor | 183 | 4 |
| 169 | Vannarpet | 181 | 5 |
| 170 | Jogupalya | 181 | 5 |
| 168 | Neelasandra | 181 | 7 |
| 166 | Shanthi Nagar | 180 | 8 |
| 115 | Konena Agrahara | 176 | 9 |
| 173 | Ejipura | 152 | 10 |
| 97 | Kadugodi | 29 | 216 |
| 5 | Kogilu | 25 | 217 |
| 3 | Atturu | 24 | 218 |
| 104 | Varthur | 19 | 219 |
| 86 | Challakere | 7 | 220 |
| 88 | Kalkere | 6 | 221 |
| 98 | Hudi | 3 | 222 |
| 7 | Thanisandra | 2 | 223 |
| 26 | Dodda Bidarakallu | 2 | 224 |
| 87 | Horamavu | 0 | 225 |
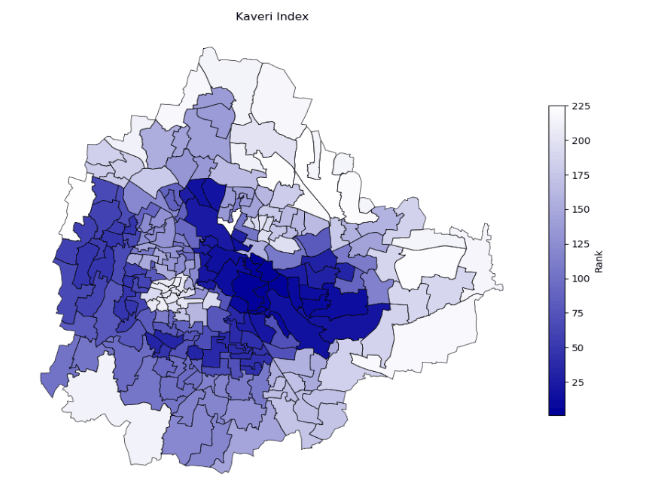
The results were plotted on to a heatmap in the figure below:
- The blue end of the spectrum represents the wards with highest per capita Cauvery supply
- The white end represents wards with the lowest per capita Cauvery supply

- As can be seen, the peripheries of Bengaluru fare poorly in terms of Cauvery supply, clearly indicating that supply has not kept up pace with the rapid expansion of the city. The situation will change post Cauvery V stage implementation, which will service a lot of these areas.
- Interestingly, certain areas in Central Bengaluru (for example Chamrajpet, Azad Nagar, New Guddadahalli) also fare poorly. This can be attributed to rapid population growth and the high leakage rates in the water transmission network. The SW1 division, for instance, lost a staggering 65% of the water supplied to leakage in 2017 highlighting the urgent need to upgrade old infrastructure.
A note on data gap
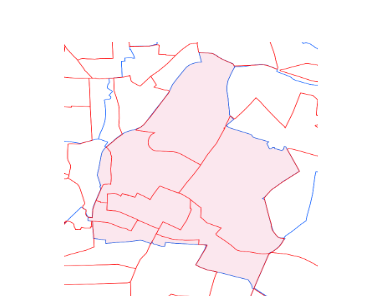
- The figure below is an extract of a particular BWSSB sub-division (blue lines) and the corresponding BBMP ward delimitation (red lines).
- As can be seen, the overlap between the two was not perfect, which complicated the analysis.
- Unified governance boundaries across departments will go a long way in simplifying this exercise.

- We have visually mapped the subdivisions in the JICA report to the ones in the Opencity BWSSB dataset. Modelling this in GIS and basing the water proportioning to be based on the built up area will fetch more accurate results.
- The population data in the wards dataset is from the 2011 Census and hence not reflective of today’s reality.
This article is the second part in a four-part series. In Part 3, the analysts will explore Bengaluru’s water security indices, analyse the results and highlight data challenges
(The other team members who contributed their insights for this article are: Swati Ganeshan, VishnuPriya Viswanathan, Ritika Gupta, Aniket Sawant, and Chandanapriya Dhanraj)