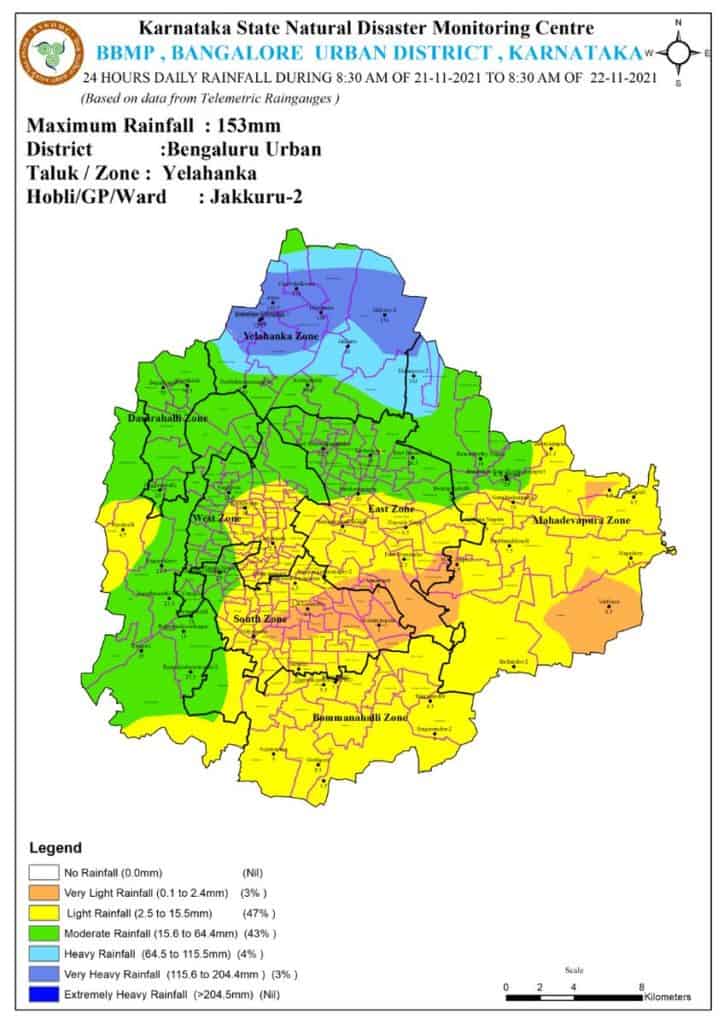
On the evening of November 21st, parts of North Bengaluru were hit by a sudden thunderstorm. Jakkur, in the Yelahanka zone recorded 153 mm. Many layouts and apartments around Yelahanka were flooded. Visuals of a flooded Manyata Tech Park went viral on social media.
November is expected to be the start of winter in Bengaluru and the end of the regular rains that start in April. As per the IMD Long Period Average (LPA) – the average rainfall between 1981 and 2010 – November gets average rainfall of only 49 mm, with four rainy days.
But this November, IMD Bengaluru recorded 277.8 mm rainfall over 15 days. Last year, it was 71 mm. The all-time record is from 2015, when the city received 296.4 mm. Readers may recall this as the year of the Chennai floods.
Since the start of October, it has felt like there has been no end to rains. What looked like a dry year till the end of September took a wet turn and it has been raining since then.
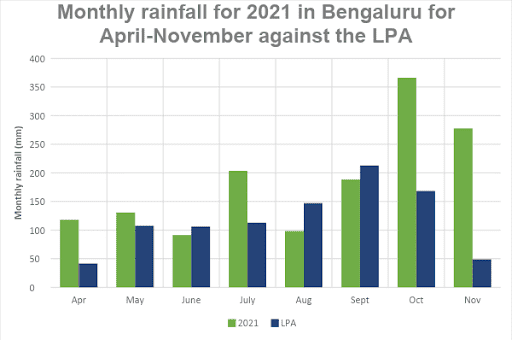
As can be seen in the graph above, the rainfall in September and August, usually the rainiest and the third rainiest months of the year respectively, were well below normal. Since October, the trend has reversed considerably.
Is Bengaluru getting wetter?
The LPA annual rainfall for Bengaluru, calculated based on rainfall between 1981 and 2010, is 986.1mm. But the annual rainfall in both 2020 and 2021 went over 1,200mm. This makes one wonder if we are seeing an increasing trend in annual rainfall in Bengaluru.
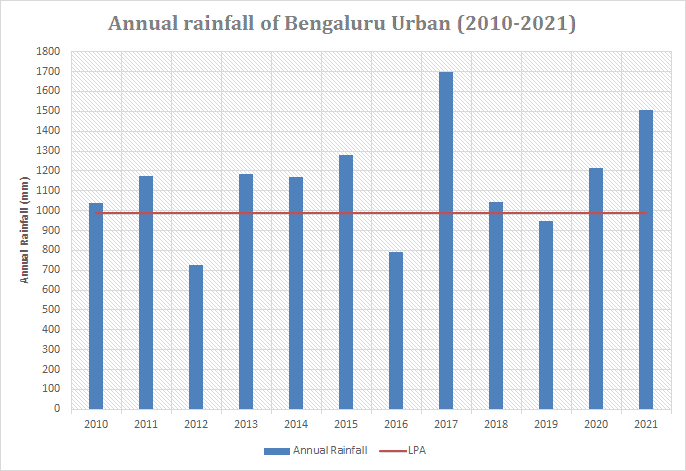
Since 2010, except for a couple of years, the rainfall has mostly been in excess of the LPA. Of the two years when shortfall was seen, 2012 was a year of drought, and 2016 recorded a very strong El Niño. This does suggest a strong increasing trend for rainfall in Bengaluru. The average rainfall between 2010 and 2021 is now 1146.62mm, 16% above the LPA.
Read more: Data from 100 years reveals the rainiest months in Bengaluru
Variation in monthly rainfall
Given that we are seeing an increasing trend in the annual rainfall, does this mean the rainfall each month is also increasing?
Even though Bengaluru’s annual rainfall is lower than other cities like Mumbai or Chennai, it is a rainy city, with rainfall starting from April (in addition to some stray showers in March), all the way till November. September is expected to be the wettest month, followed by October and August. May, June and July are expected to receive similar amounts of rainfall, around 110 mm each. April and November are the start and end of the rainy season respectively, each receiving under 50 mm of rain.
Plotting the monthly rainfall over the last 11 years (2011-2021), however, reveals an interesting picture.
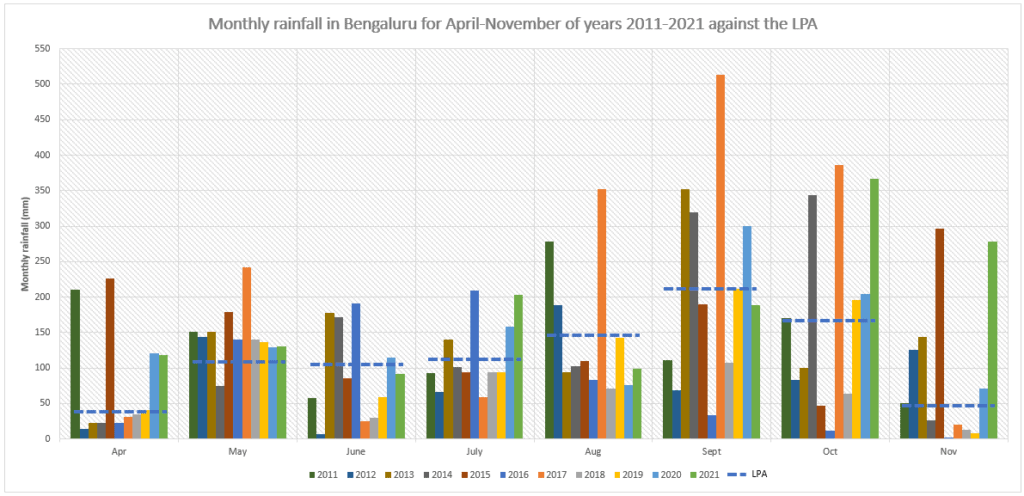
The summer rainfall in May has been higher than the LPA in almost all the years. April has been mostly under the LPA. Only time can tell whether the recent increases during the last couple of years is a trend.
June, July and August seem to be getting drier, with August often struggling to record even 100 mm. September has been receiving rainfall more or less close to the LPA, with some heavy swings above or below it. October, however, seems to be getting wetter more often. It is too early to say whether November is showing an increasing trend.
Read more: Bengaluru’s changing rainfall patterns: expert points to climate change
What we need to do about this
Increasing rainfall can be both a boon and a bane. The increase is not necessarily going to be distributed uniformly. There would be more days of heavy rainfall, and unless we are prepared, many localities will have to deal with floods more often.
As per Vishwanath S of the NGO Biome Environmental Trust, “Bengaluru will need to rework its building design and stormwater design codes to deal with the increased rainfall, and also intensity of rainfall. We need to design for short bursts of 180 mm per hour intensity and for 200 mm per day rainfall. Roof slopes, rainwater pipes, storage and recharge structures, and stormwater drains will all need to cater to this new regime of rainfall. We also need to improve our predictive powers and models of rainfall events.”
For now, the BWSSB (Bangalore Water Supply and Sewerage Board) has changed its guidelines on rainwater harvesting, he says: “Every square metre of roof will need to harvest 60 mm rainfall per day (up from 20 mm). Every square metre of paved area around buildings needs to harvest 30 mm rainfall per day (up from 10 mm). This would mean bigger/deeper recharge wells and sumps.”
“With better prediction, better planning, better design and implementation, we can turn these rainfall events into a resource rather than a flooding problem,” he adds.
Cauvery reservoirs have filled up
Cauvery reservoirs usually fill up by early August. This year, at the end of September, it looked like we may have to deal with unfilled reservoirs for the first time since 2017. However, bountiful rains in the catchment areas in October have ensured that Cauvery reservoirs now have more water than at the same time last year.
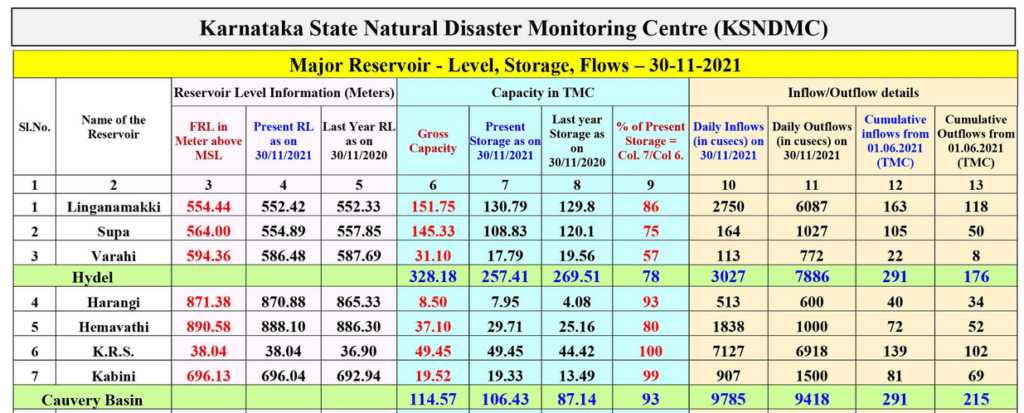
Currently, Cauvery river supplies 1450 Million Litres per Day (MLD) to Bengaluru, which meets over half of the city’s water requirement. Full reservoirs means that we can go another year without worrying about the supply in summer months. It also means that we can start the monsoon of 2022 with more in the tank than leaner years.