Data from BBMP shows that Bengaluru’s 198 wards have together contributed Rs 5430 crores as property tax over the last three years.
- 2016-17: Rs 1743 crores
- 2017-18: Rs 1761 crores
- 2018-19: Rs 1926 crores
The tax collection by ward varies from one extreme – 282 crores in three years collected by Bellandur, to another – 69 lakhs collected in Chalavadipalya. Bellandur which occupies 3.6% of the area covered by Bruhat Bengaluru Mahanagara Palike (BBMP) has collected Rs 103 crores out of Rs 1926 crores, that is more than 5% of the total collection.
The top 34 wards have contributed almost 50% of the total tax collection in three years, which is about Rs 2729 crores.
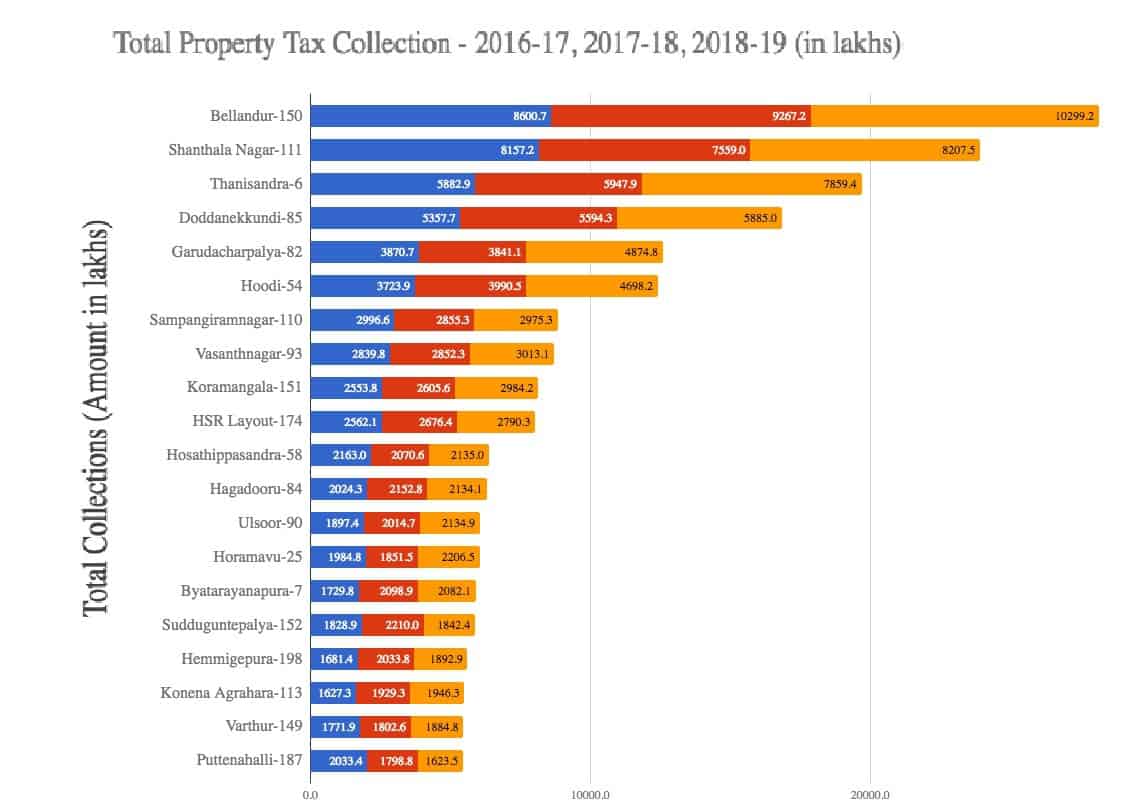
Check the amount of property tax each ward has paid, in the below interactive map. Property Tax collections by ward (in lakhs)
The top five wards together contributed 1,012 crores or 18.6% of the tax collected over 198 wards! They are:
- Bellandur, ward 150. This area around Sarjapur Road-Outer Ring Road contributed a whopping 282 crores. It also has the most no of buildings 3+ floors, and grew by almost 300% in the decade 2001-2011.
- Shanthala Nagar, ward 111. This central area covers the Central Business District including MG Road and brings in 239 crores
- Thanisandra, ward 6. This ward in Yelahanka zone that contributed 197 crores is where you will find Manyata Tech Park and many corporates.
- Doddanekkundi, ward 85 and Garudacharpalya, ward 82 contribute 168 and 126 crores respectively. These areas are where you will find the top IT firms of Whitefield.
These top wards are mostly from the newly developed peripheral areas, except for Shantala Nagar in the centre of the city. But if one were to look at the average annual tax paid per property in the three years, the older areas lead. This could be due to the high value of real estate in these areas. The average contribution of individual property is as follows, for top five wards:
- Shanthala Nagar-111: Rs 83602
- Garudacharpalya-82: Rs 51961
- Vasanthnagar-93: Rs 48562
- Sampangiramnagar-110: Rs 46293
- Sudham Nagara-118: Rs 44809

In these three years, the wards under Mahadevapura Assembly constituency (which also includes some rural areas) brought in Rs 887 crores, while the wards of BBMP zone Mahadevapura collected Rs 1072 crores.
| BBMP zone | Total Applications | Total Collection
(Amount in lakhs) |
| Bommanahalli | 576737 | 534.59 Cr |
| Dasarahalli | 181279 | 169.87 Cr |
| East | 664510 | 1193.34 Cr |
| Mahadevapura | 635819 | 1072.36 Cr |
| RR Nagara | 478187 | 342.8 Cr |
| South | 612041 | 974.13 Cr |
| West | 504474 | 695.7 Cr |
| Yelahanka | 395524 | 447.66 Cr |
The top two wards in terms of number of tax applications were Horamavu and Begur: 97,459 and 82,144 applications each, with Bellandur coming third with 82,081 applications.
How developed are these wards?
It is not surprising that the top contributors are from the periphery of Bengaluru, especially in eastern and south-eastern parts. They are among the largest in area. The recent spurt in growth here has led to way more properties, especially commercial buildings including corporate offices and tech parks, than older parts of the cities.
The top wards have many corporates and IT parks, as well as huge apartment complexes contributing to the city’s coffer. However the state of their infrastructure is dismal. Census 2011 data shows that Bellandur has just 74% piped sewerage and 57.9% tap water, compared to Shanthala Nagar which at second place has above 95% coverage for water and sewerage.
Data also shows that Hoodi which contributed a mere 7.8% households connected by pipe sewer (in 2011) contributed almost Rs 1241 crores.
At the bottom end are Chalavadi Palya-Ward 138 (Chamrajpet Assembly constituency) which saw a tax collection of 69 lakhs. It is however a very small ward, with a population of 24801 people living in 0.4 sq km. The second lowest is Devarajeevanahalli-47 in Pulakeshi Nagar constituency, which contributed Rs 1.43 crores. This has one of the largest slums in Bengaluru, ie, DJ Halli. Former Mayor Sampath Raj is the corporator here.
The 100 wards led currently by BJP corporators brought in Rs 2812 crores, while 76 wards that have INC corporators contributed Rs 2136 crores and JD(S) Rs 212 crores (14 wards). This means wards that elected BJP and INC brought in an average of 28 crores and JD(S) wards provided an average of 15 crores.
To get more details about how much property tax your ward contributed, check http://opencity.in/data/bbmp-property-tax-collections-financial-year-2016-2019
Pathetic work in terms of infrastructure.
It doesn’t even have the basic amenities of water And road based on the amount of money we are shelling out for tax.
No where close to world class
This shows Bellandur is not sustainable. Population density is very high, people should avoid Bellandur.
BBMP is a cash blackhole. It take money, but no one knows where it goes after that. Most of the Bangalore arterial roads are in bad condition. Always clogged with vehicles.
Areas like Bellandur, Harlur etc. are un-livable due to non-availability of basic infra. BBMP is killing Bangalore..