Pandemic or no pandemic, when it comes to urban mobility especially in cities like Bengaluru, the reality is that the private vehicle is here to stay, whether powered by petrol or electricity, and along with it, traffic jams.
But even if public transport buses and Metros were running normally, is it possible to determine the factors that affect an individual’s choice of a particular mode of transport? If such factors are identified, they could then be included in public decision-making.
For example, if it is determined that distance to a transit station is the key factor in people using cars, then investments can be made in expanding the transit network. On the other hand, if distance to a transit station is not a key factor, i.e., despite an extensive transit network, people still prefer cars, then one may investigate the reasons why the transit network is unused: is public transport expensive? Are the stations unclean?
The ‘why’ of commuter choice
We wanted to get some insight into the transportation habits of people and answer questions like: Why do people bicycle? Why do they not? Why do they drive large cars over narrow roads? Etc.
The World Resources Institute (WRI) is an environmental think tank that researches problems at the intersection of environment and development. The WRI conducted a survey in two cities (Bengaluru and Indore) that gathered information about the preferred means of transport of about 3000 residents, and the factors that possibly determine them (e.g., age, income etc.).
I am a Grade-11 student of Inventure Academy, and the WRI was kind enough to give me raw survey data to make sense of, and mentored me through the process.
As seen in the screenshot below, the survey contains a very large number of fields of anonymised data relating to commuters: the location of their homes, their age, their daily commuting expense, time spent commuting, their household incomes, their gender, their relationship to the head-of-household, their occupation, their marital status, and their usual mode of transport.
The question is: Which of these factors best predict the preferred mode of transport? Can we make statistically accurate statements like: women habitually avoid the bus, or younger people tend to drive?
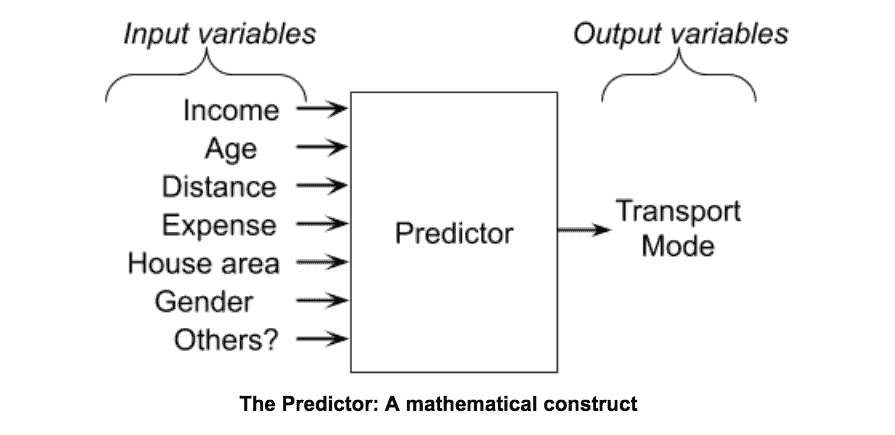
It turns out that there is a mathematical technique to study such social problems (math is not just for physicists). We build what is known as a predictor (see above), a software tool that ingests a number of variables (believed to be correlated to the choice of transport), and as its output, predicts the choice of transport.
The predictions are then compared with the actual choice of transport (available through the survey). And If the predictions are by-and-large correct, we would’ve identified the key factors influencing the transport mode and possibly try to establish causality, that is cause-and-effect.
Predictability of transport-choice
There are all manner of predictors available. A linear predictor weighs-and-adds the input factors to arrive at a prediction. A neural network passes the input factors through layers of non-linearities and sums the results to arrive at a prediction.
The human brain, the original and archetypal neural network, is a consummate predictor; humans are constantly trying to find patterns even where they don’t exist. But the human brain can deal with one or two input factors (the traffic is high at 5 pm on all days save Sundays, the variables here being time and day-of-week), but not tens, hundreds, or millions of inputs.
I used the simplest type of predictor, namely the linear predictor. Of the many predictor packages available, I used Analytics Solver for Excel. The predictor gives a measure of how well the predicted choice of transport matches with the actual choice of transport. In the arcana of data analytics, this measure is known as adjusted-R2 (pronounced adjusted-R-squared). The closer the adjusted-R2 is to 100%, the better a particular input factor is correlated with the output (i.e., choice of transport).
Two other measures of predictor performance are missed detection and false alarm. As their names suggest, a missed detection is when you predict that the commuter does not take (say) a bus, but in truth she does (i.e., you didn’t detect the bus as the right mode of transport).
False alarm is the opposite of missed detection: when you predict that the user did take a bus, but in truth she didn’t (i.e., you falsely detected the presence of the bus). The terms missed detection and false alarm originate from the field of radar science. The aim is to keep both missed detection and false alarm rates low.
With that lengthy preamble, it is now a simple matter, in principle, to feed the data into the software predictor and turn the crank (press the enter key). The results are below:
| Output | Adjusted-R2 | Principal predictors | Fraction Missed | False-Predict Fraction |
|---|---|---|---|---|
| Bus (19% of users) | 46% | Gender, Age, Relationship to HoH | 36% | 35% |
| 2W (71% of users) | 73% | Relationship to HoH, Occupation, Marital Status, Age, Gender | 36% | 30% |
| Auto Rickshaw (6% of users) | 1.5% | NONE | 60% | 20% |
Table 1: A summary of the findings for Indore
Table 1 tells us that the main predictors of whether a user will take a bus or not is their gender, age, and relationship to the head-of-household. The main predictors of whether a user will take a two-wheeler (or not) is their relationship to the head-of-household, occupation, marital status, age, and gender. There is very little confidence (adjusted-R2 = 1.5%) in the prediction for auto-rickshaws.
Curiously, although the two-wheeler prediction enjoys a high adjusted-R2 of 73%, the probabilities of missed and false detections are still quite high, more than 30% each. Thus, by the measure of adjusted-R2, two-wheelers are well-predicted by user factors, but by the measure of missed detection and false alarms, they are only moderately predicted by user factors.
| Output | Adjusted-R2 | Principal predictors | Fraction Missed | False-Predict Fraction |
|---|---|---|---|---|
| Bus (25% of users) | 13% | NONE | 34% | 45% |
| 2W (17% of users) | 52% | Age, Relationship to HoH, Marital Status, Occupation | 38% | 39% |
| Walk (47% of users) | 57% | Expense (MAYBE: if the expense is below a certain amount then it strongly predicts walking?) | 0.6% | 4.1% |
Table 2: A summary of the findings for Bangalore
The most striking observation to emerge from Table 2 is that walking is highly predicted (that is, it has low probabilities of missed detection and false alarm) by just a single user factor, namely the user’s daily transportation expense. In simpler terms, you walk only when you cannot afford to take a bus (or auto-rickshaw or car).
Now, here’s a speculative explanation of causality, and possibly a public-policy gem as well: It ought to be the wealthier people who should be walking, for they are the ones contributing to traffic. Maybe the footpaths should be fixed and made widely available, continuous, and uninterrupted. Maybe then those who create traffic jams might try to walk to reduce the jams?
Isn’t that incredible? Mathematical tools and data analytics can be used to study problems in the social sciences. And feed into public policy, if somebody is listening.
[Acknowledgement: I gratefully thank Mr. Pawan Mulukutla of the World Resources Institute for giving me this project, mentoring me through its execution, and giving me access to WRI’s survey data.
Reference: The report in its entirety, i.e., with full technical discussion, is available here.]
Wow!! Congratulations Vishal! The article is so well written – for someone like me who runs away from numbers and complicated formulas – for the first time I found myself reading with interest and understanding!!! Learnt a lot! Thank you Vishal!