The years 2013 and 2014 stand out in the State of Health report for Mumbai released by Praja Foundation. With a discrepancy of over thousands of deaths in those years in the age group of 0 to 4 for diseases such as hypertension, diabetes and tuberculosis, the data raises more questions than answers.
Collected from all the 24 wards under Brihanmumbai Municipal Corporation (BMC) through RTIs up until 2015, the data shows strange figures for the cause of death among various age groups.
For instance, the data shows that in 2013, 1,612 children in the age group of 0 to 4 died due to diabetes in Mumbai as opposed to 530 people in the age group of 60 and above. However, the data for the year 2012 shows a more plausible picture where there are three deaths in the age group of 0 to 4 and 1,908 deaths in the age group of 60 and above.
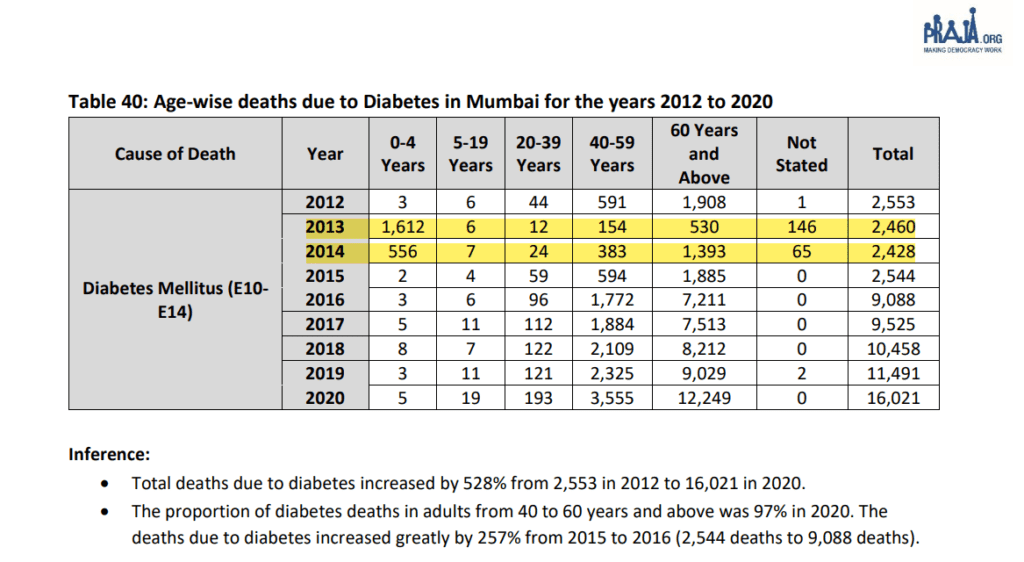
There is a sudden jump in the numbers from 2016 onwards where we see the number of fatalities rise amongst the 60 and above age group, which is in fact the category that is considered to be at a higher risk of death due to the disease.
Similar is the case with diseases like hypertension where the data for 2013 suggests that there were 3,041 deaths in the age group of 0 to 4 as opposed to 173 deaths in the age group of 40 to 59 and 953 in people above 60 years of age. The number slides down from 2015 onwards for deaths due to hypertension in the 0 to 4 age group shows a jump in the age group of 40 to 59 and 60 and above.
Public health researcher and doctor Sylvia Karpagam said the cause of death data can help authorities and activists direct resources for timely intervention. “Long-term data shows us trends over a period of time, and enables us to make associations and connections. This helps in making policies but when we don’t have an accurate picture, the way policies are made can be largely assumption or ideology-driven,” she said.
Praja’s data source changed after 2015 as the civic body adopted the central government’s Civil Registration System in 2016 and eventually the NGO started receiving annual collated data of all BMC wards from the State Bureau of Intelligence and Vital Statistics (SBHIVS) through RTIs.
While the NGO admits that there may have been a few mistakes in the inferences made by their team below the data tables in the report, it stands by the accuracy in presenting the data they received from the civic body. On the other hand, BMC officials contest this claim and suggest that there may have been a mistake on the part of Praja.
Refuting the 2013 figures in the Praja report, an official from BMC’s health department Management Information System (MIS) said that according to the data they have for that year, there were 40 deaths due to hypertension in the age group of 0 to 4. The official added that even 40 deaths due to hypertension are unlikely.
Head of the Paediatrics department at King Edward Memorial Hospital, Dr Mukesh Agarwal was shocked to learn of the high numbers in the Praja-obtained RTI data, as well as BMC’s data with regard to hypertension fatalities for the age group of 0-4.
“Even if there were 40 cases, medical practitioners most likely did not examine the other causes in that. For example, kidney disease like nephrotic syndrome is very common amongst this age group which can lead to hypertension, but hypertension by itself cannot be a cause,” said Dr Agarwal.
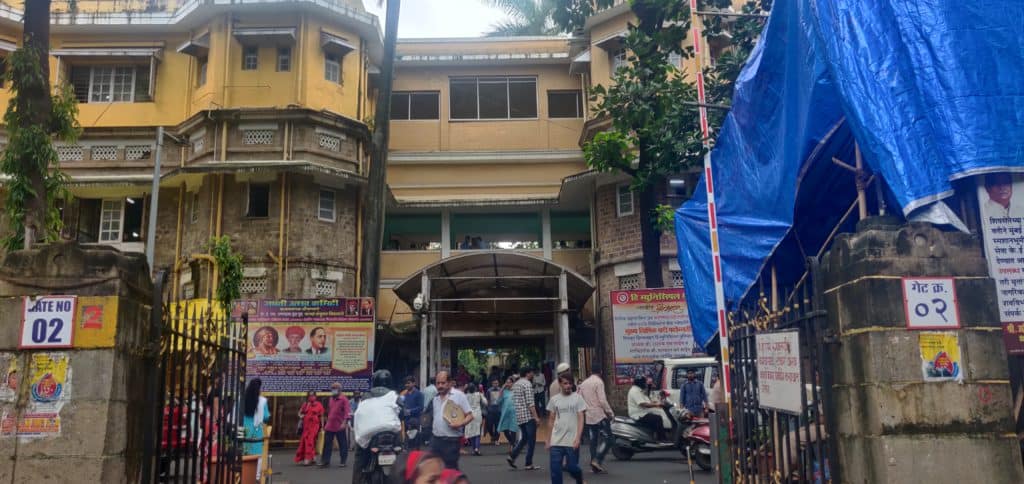
The common causes of death in the age group of 0 to 4 vary depending on how old the child is, Dr Agarwal said. “Fatality in premature and low birth weight babies who are less than 28 days old is common. After 28-days to one year, the common causes are respiratory infection and then diarrhoea, malaria, and dengue. In 2013, diarrhoea was very common but now it is not that common.”
Conflict of numbers
Praja has been obtaining cause of death data since 2011 and has added various diseases in its report over the years, even as they have further classified the data by age. In 2015, the NGO’s publication of tuberculosis data and the variations in the data reported by the BMC also made the news. The total TB deaths in Mumbai stood at 6,589 in 2014 if we are to go by data of all death certificates obtained by Praja, whereas BMC’s TB cell had reported only 1,351 deaths due to the disease that year.
BMC officials told The Indian Express at the time that the difference in figures was because TB has been mentioned on the death certificates by medical officers, even though it was not the actual cause of death. A similar reason was cited by the officials while speaking to us this year, when we enquired about the high number of deaths in the age group of 0 to 4 due to other diseases.
While the total number of TB deaths in Praja’s RTI-obtained data has gone down since then, it is largely because fatality in the age group of 0 to 4 shows a dip over the years. For instance, their data shows that 1,602 children in the age group of 0 to 4 died due to TB in 2014 but this number came down to 50 in 2015, when the total number of deaths due to TB was 5,693. In 2019, deaths in the 0 to 4 age group was 37 with a total of 4,899 TB deaths.
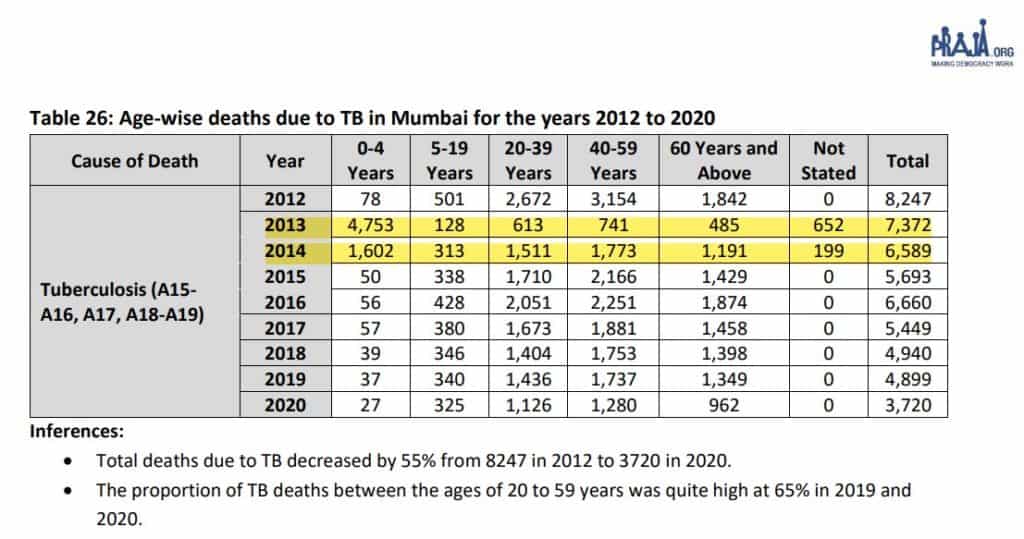
Notably, differences remain in the RTI responses Praja received and the data released by the BMC as the civic body recorded a total of 3,059 deaths due to TB in 2019.
Possible reasons for discrepancy
BMC’s Deputy Executive Health Officer Dr Daksha Shah said, “There can be human errors. It depends on who wrote the cause of death at the time and how they assigned the disease code to it. We will have to delve into further detail to understand how that number has been derived.”
Speaking about the possible reasons for the discrepancy in 2013 and 2014 data, Keskar told us that the medical practitioners at the time may have arbitrarily written the cause of death. However, she clarified that further study of data is required to provide any well-informed analysis.
“I do not know what has happened but writing the correct cause of death is very important and doctors are being trained over the years. But if a doctor is not vigilant enough and casually tick the boxes, we can get such a bizarre picture. An error can also happen in the later stage when it is entered into the system, human error can happen anywhere,” Dr Keskar said.
Read more: Were there more COVID-19 deaths in Mumbai than we know?
How the cause of death is reported
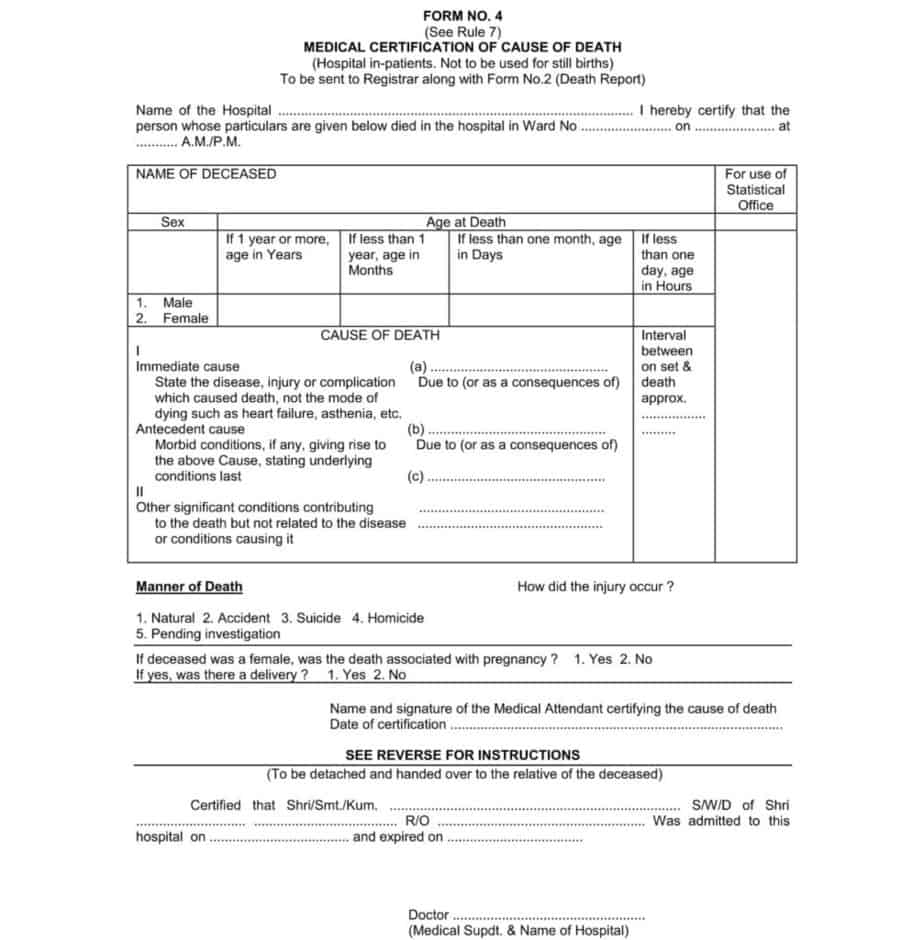
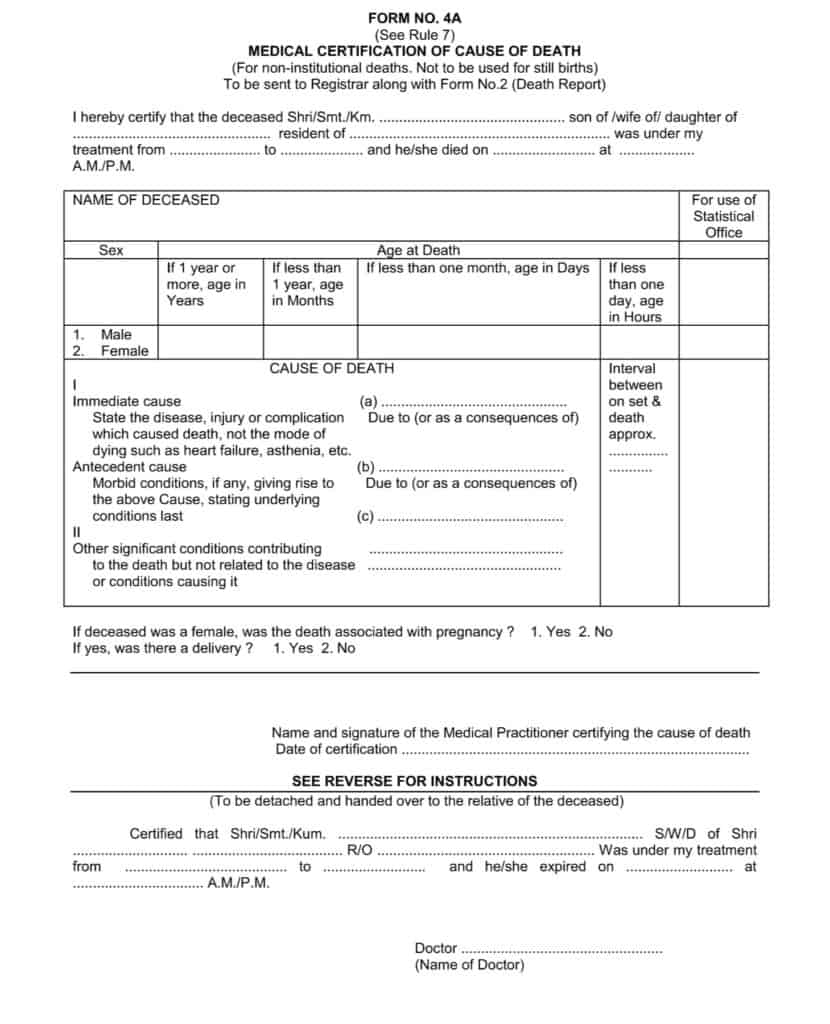
India has adopted the World Health Organisation’s format in the Medical Certification of Cause of Death (MCCD) forms for institutional and non-institutional fatalities. “A medical person attending the deceased in his/her last illness, after the death of a person, shall fill in form No. 4 for institutional deaths/ 4A for non-institutional deaths,” states the MCCD training manual by SBHIVS.
Both the forms contain some minimum demographic particulars such as age, sex and date of death. The forms have two parts with a section for the immediate cause of death at the beginning and a section for the underlying cause of death towards the end of Part 1. The last section is then used for statistical classification of causes of death.
“Completeness and accuracy with which the certificates of cause of death are filled by the attending physician are of prime importance in building the base of the cause of death statistics,” the manual states.
Dr Jitendra Jadhav, a senior medical officer with BMC and former medical in-charge of L ward, said the responsibility of framing the cause of death for non-institutional deaths lies with a registered medical practitioner, and then the ward medical officers codify the data from the two and send it ahead to the MIS cell.
Sloppy paperwork
Multiple BMC officials have been claiming that inaccuracies in reporting of cause of death are due to negligence of private medical practitioners filling up the 4A form for non-institutional deaths and the civic body has been focusing on training them.
“Even now there are cases where practitioners continue to write cardiorespiratory arrest as the cause of death, no one dies of cardio-respiratory arrest as it is just one of the manifestations of death. A person won’t die unless there is an additional factor in such cases,” Dr Agarwal said.
He added that it is only in the last few years that special training courses are being held on how to certify the death. “We still see the same old errors and it will take some time for the system to improve. Reporting of the cause of death needs to be accurate and there has to be a thorough verification for human errors while doing further data analysis. After that those who are responsible for data interpretation must know some basics on common causes of fatality in various age groups.”
‘It was their mistake’
Praja Foundation CEO Milind Mhaske said numbers are thoroughly checked before they are published. “All the data we collect is through RTI. The numbers show an anomaly but we won’t have the answer for that because the BMC officials have allocated those causes. Whatever numbers we have provided are accurate as per the data we have received,” he said.
There were several attempts made to reach BMC’s executive health officer Dr Mangala Gomare but she remained unavailable to comment. Mhaske believes the inaccuracy in the RTI obtained data can be ignored as long as the total number of deaths in the city and total deaths under various diseases do not show an unusual trend over the years.
To explain Mhaske’s position on the matter, let’s look at the diarrhoea death numbers in the Praja report: A total of 177 children in the age group of 0-4 died due to diarrhoea in 2013, and this number was 114 in 2014. When we look at the total diarrhoea deaths combining all ages in both those years, it comes to 265 in 2013 and 262 in 2014. This total more or less remained the same for the last ten years, with 246 deaths due to diarrhoea in 2012 and 228 deaths in 2020.
However, what changed over the years was the break-up in terms of age demographics. The number of deaths due to diarrhoea in the age group of 0-4 was in double digits in 2015 and the deaths in the age group of 60 and above were in triple digits in 2016.
In 2014, the total number of deaths in Mumbai was reported to be 93,254 and for the last ten years, the city has been registering more than 85,000 deaths. The total numbers shot up excessively in 2020 and 2021, which can be attributed to the COVID-19 pandemic.
“It is very difficult to say what went wrong in those two years (2013,2014) but it can safely be attributed to some kind of a human error. From an advocacy point of view, there needs to be a careful analysis by the authorities in terms of how training for writing causes of death is imparted,” he said.
Karpagam explained what the cause of death data can achieve and what can go wrong when we don’t know how people are dying. “When people are dying from preventable causes, the system might not want to show it because it shows them in a bad light, but knowing who is dying and how they are dying can help us frame national policies,” she said.
She added that an error on the cause of death certificate can sometimes also lead to people being left out of compensation for death by diseases like COVID-19.
Thanks Eshan for sharing the link and sharing very useful narrative with opinion of collators, reporters, experts. 1. Death count of a population is believed to be very essential for the Govt, service providers, general public from the perspective of resource allocations, advocacy, bringing precision in clinical management respectively. 2. Mumbai has noteworthy record of 100% death registration since British Raj, although it is still evolving from quality and consistency perspective. Death data discrepancy may be treated as system issue rather than enabling stakeholders to defend their side. I understand MCGM has entrusted Bloomberg agency to establish a training platform to improve cause of deaths in Mymbai besides addressing other relevant concerns in death data quality. 3. All the opinions expressed in the narrative have definite merit. The WHO format (form 4 for institutional deaths and 4A for non- institutional deaths) with part I (immediate, antecedent and underlying cause) and part II (associated factor or comorbidity) is self explanatory. The underlying cause triggering the process leading to death is the crux. 4. The hypertension, Diabetes Mellitus, Malnutrition … are usually construed as “Risk factors” rather than the underlying cause of deaths; while cardiovascular arrest is “mode of dying” and not the underlying cause of death as cited. 5. The precision of cause of deaths is likely to be compromised after 70 years largely because the cumulative exposure to risk factors till this age may depict multiple comorbidities to make matter worse. 6. Medical attendee reviewing the deceased or the case sheets is likely to fumble while translating his/ her clinical impression in to ICD 10 code as cited. 7. It would be worth considering to set up a mechanism for consistency checks of CODs at MCGM level even though it has some cost. This would transform the death data substantially though not 100%. 8. Deaths can also be attributed to developmental aspects of society and therefore comparing the diarrhoea deaths with success of ODF campaign is also a welcome concept. The findings of NFHS rounds or SRS and the MCGM death data could be used to validate each other. 9. Constant influx of population and a phenomenon of “late referred in “ to Mumbai May also be kept in mind while interpreting the death counts (age and sex wise, residential status wise…)