An analysis of BBMP’s work order data over the last five years shows 74% of funds were meant for roads and drain works. From “Remodelling of stormwater drains, culverts-bridges and allied works” to “White Topping on selected roads” – the packages range from a few lakhs to many a crore.
Bruhat Bengaluru Mahanagara Palike (BBMP), Bengaluru’s city government, administers an area with a population of around 12 million and has a budget of around Rs 11,000 crore as of 2023-24. In spite of its massive expenditure on civic works, BBMP is often in the news for all the wrong reasons, like poor roads, flooding, corruption, etc. This analysis looks at how BBMP has been spending its money in the past five years; which segments got the most spending allocation – roads, drains or waste management. And in which parts of the city most of the spending happened.
Read more: Bengaluru, here is where all the taxes you pay end up
To understand which areas got the most projects, we aggregated the wards into constituencies. While BBMP’s main geographical unit is Wards, we wanted to see a high-level overview of where spending happened. We chose to group the data by Assembly Constituencies (rather than BBMP zones). Given that the BBMP has been without an elected council for three years, a lot of these decisions are taken in the corridors of Vidhana Soudha, Karnataka’s State Assembly.
Disclaimer
This analysis is based on work order data available on the BBMP site. It is not complete or comprehensive. An average of Rs 4,650 crore over the five years explains only part of the actual expenses. BBMP has mentioned payments of above Rs 6,500 crore each year. Here are the amounts spent as listed in the subsequent years’ budget book:
- 2018-19: 7709.42 crore
- 2019-20: 6752.15 crore
- 2020-21: 7926.35 crore
From the data, individual work orders are issued for a maximum of Rs.50 crore. It is not clear where the work orders of the big infrastructure projects like flyovers and underpasses are listed.
There are also likely to be discrepancies between work orders issued and actual payments. This analysis does not also indicate whether the work was done as per the work order and when the payments were made and for how much.
However, we believe this gives citizens a bird’s-eye view of the public works taken up in their neighbourhoods. We encourage residents of each neighbourhood to correlate the work order with the actual project status and evaluate the project’s outcome. Do check Open City to understand how to get details of the individual project.
BBMP workflow for public works projects
The details of the works were taken from the BBMP website (‘Works Bill Public View’ page). The data included ward-level works and some work orders from functional departments. It is likely that the site does not include all work orders issued in these years. Large projects like flyovers and underpasses are not part of this list.
Every work that BBMP undertakes is supposed to be based on its annual budget document. For individual works, separate job codes are created. Each work has to be officially sanctioned by BBMP. After this, BBMP floats a tender for the work through a tender notification. For some small works – such as cleaning of one drain – tender may not be called. Every work should have a work order. A work order will mention the contractor’s name, company and address, scope of work, time limit to complete the work, and the signature of the officer who issued it. Starting from the date of the work order, the contractor is obligated to finish the work within the specified deadline. Details of the work are supposed to be displayed at the work site as well.
What works did BBMP plan to execute?
In the past five years, BBMP issued Rs 23,241 crore worth of work orders, for an average of Rs 4,650 crore per annum.
Ward-level spends
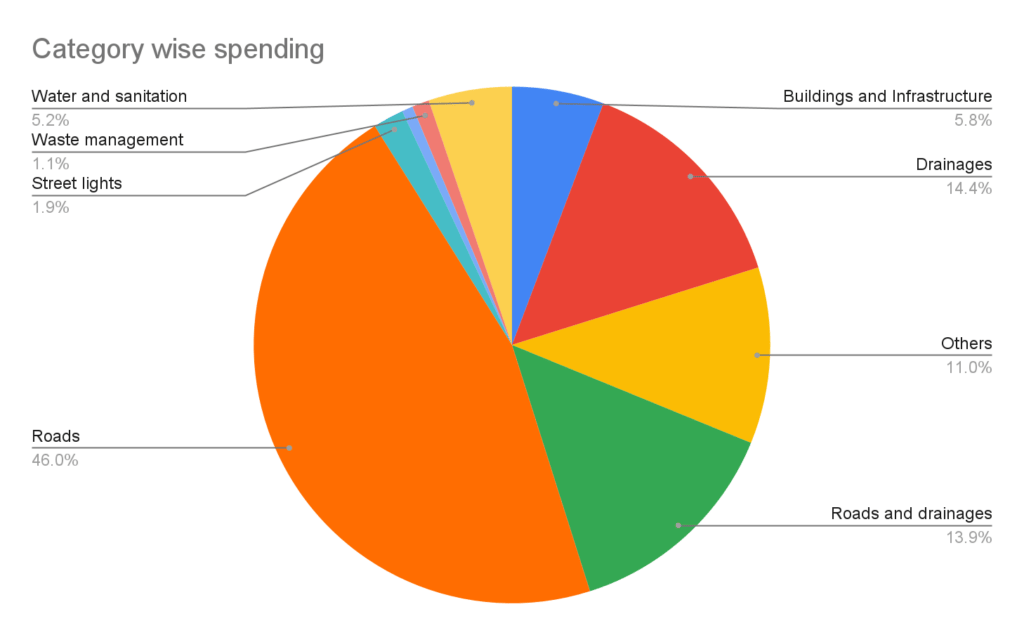
Of this Rs 23,000 crore, the amount allocated for ward-level works was Rs 15,217 crore. The percentage of the total amount issued for each category in the past five years is shown in the chart below. It can be seen that the largest share of the funds, close to half the total, was on roads. This was followed by drainage, and roads and drains. Together, roads and drainage work accounted for 74.3% of total spending. Water and sanitation got 5.2%, while waste management, one of the most visible functions of BBMP, got only 1.1%.
Functional/Non-ward expenditure

Of the remaining, Rs 8,023 crore was on work orders across functional departments and non-ward projects. In this, close to 50% (Rs. 3,938 crore) was spent on stormwater drains, and 24% on roads and drains-related work. Work orders issued for Major Roads saw a share of 10.7% (Rs 858 crore). Work orders for white-topping come under both “Roads and Drains” and “Major Roads”. Together these heads account for 34.3% of the spend or Rs 2,755 crore. Rs 441 crore was meant for lakes.
Work orders for projects within wards and constituencies
Within the work orders marked by a ward number (1-198 for old ward numbers), this is what we found:
NOTE: There will be additional spends on each category if we include the work orders tagged under functional departments. But given that it is not easy to correlate each of those projects with an individual ward, we have not considered those.
Aggregated across the 28 constituencies, the work order amount in each category can be seen in the chart below.
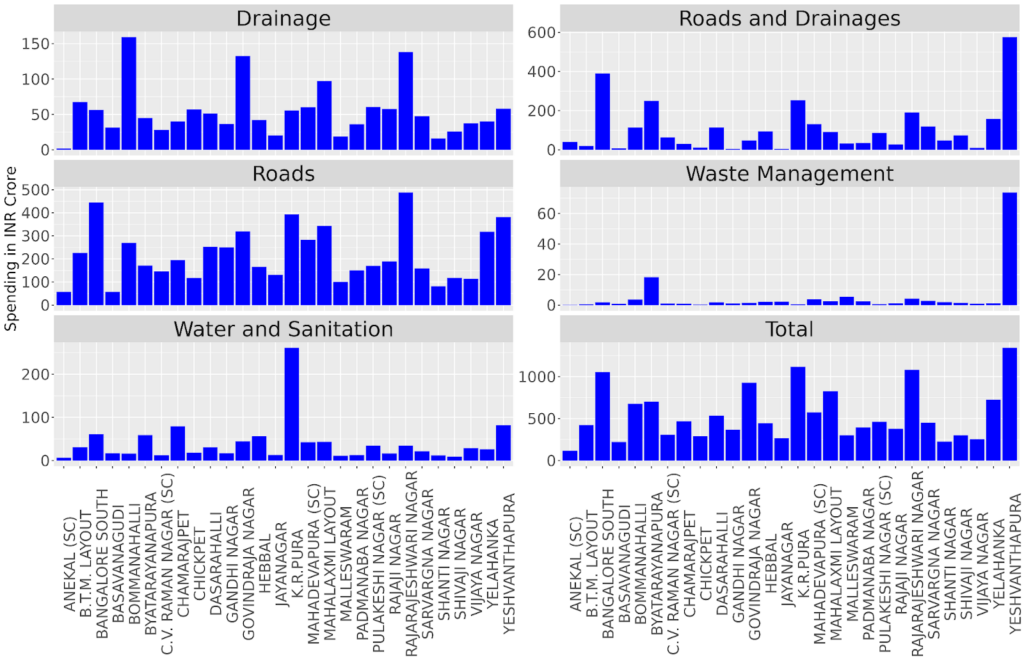
Yeshwanthpura, Rajarajeshwarinagar, KR Pura, Bangalore South and Govindarajanagar are constituencies where larger amounts have been allocated. Shantinagar, Vijayanagar and Basavanagudi are seen to have had the least spending. The size and location of the wards obviously matter – the outer wards are larger and less developed. It needs to be mentioned that Anekal has only one ward that falls under BBMP and any expenditure in Anekal is restricted to just that ward.
Rs 3,345 crore on drain work orders
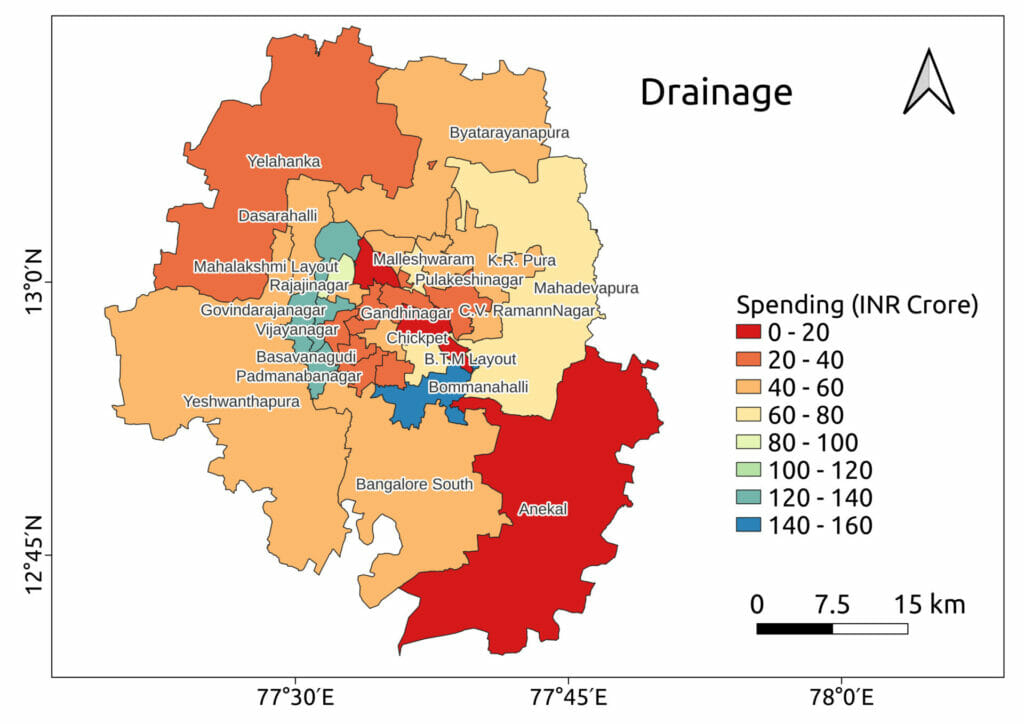
Rs 3,345 crore was planned to be spent on drainage in the past five years. The spending on drainage was highest in Bommanahalli, followed closely by Rajarajeshwarinagar (RR Nagar), Govindaraj Nagar, and Mahalakshmi Layout assembly constituencies. On the other hand, Anekal, Shantinagar, Malleswaram and Jayanagar are seen to have very little spending in this category.
Also interesting to note is that KR Pura and Mahadevapura constituencies, which bore the brunt of flooding in 2022, have not had very high funds for drainage in the past five years despite increasing population and high density of lakes. However, one needs to look at the complete list of work orders in departments like CE Lakes and CE SWD and map them to actual works in the correct neighbourhoods to make better sense of this. As can be seen from the second chart, storm water drains accounted for close to Rs 4,000 crore at the non-ward expenditure level and it is hard to know which wards got those orders.
The map below shows the work order amounts for drainage for all 28 constituencies. It can be seen that the interior constituencies get relatively smaller amounts compared to the ones at the periphery.
Work orders for roads
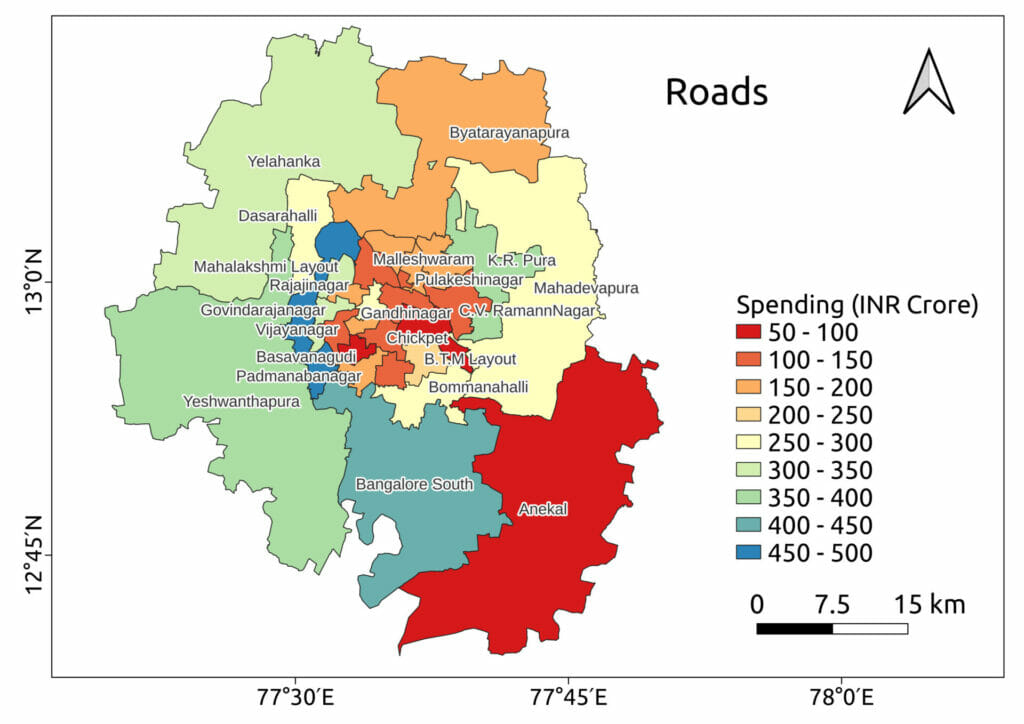
In the past five years, Rs 10,683 crore was planned on road infrastructure that did not include drains. This amount was highest in Rajarajeshwarinagar followed by Bangalore South, KR Pura, Yeshvantapura and Mahalakshmi Layout constituencies, while Basavanagudi, Anekal, Shantinagar and Malleshwaram saw the lowest amounts.
From the map below we can see that the most spending on roads happened in the peripheral constituencies. But some constituencies in the interior also got a large chunk of funds for roads, like Mahalakshmi Layout and Govindarajanagar.
Again a disclaimer like for drains, applies here: The spending on roads includes mostly maintenance and laying of roads. White-topping is considered a non-ward work order and is mentioned in the earlier section.
Work orders for roads and drains
Where roads and drains were combined together as work orders, BBMP spent Rs 3,237 crore in the past five years. Yeshwanthpur, Bangalore South and KR Pura saw the most spending, while Jayanagar, Gandhi Nagar, Basavanagudi and Vijayanagar saw the least.
It can be seen from the map of expenditures below, that the most spending on roads and drains was again in constituencies located in the city’s periphery.
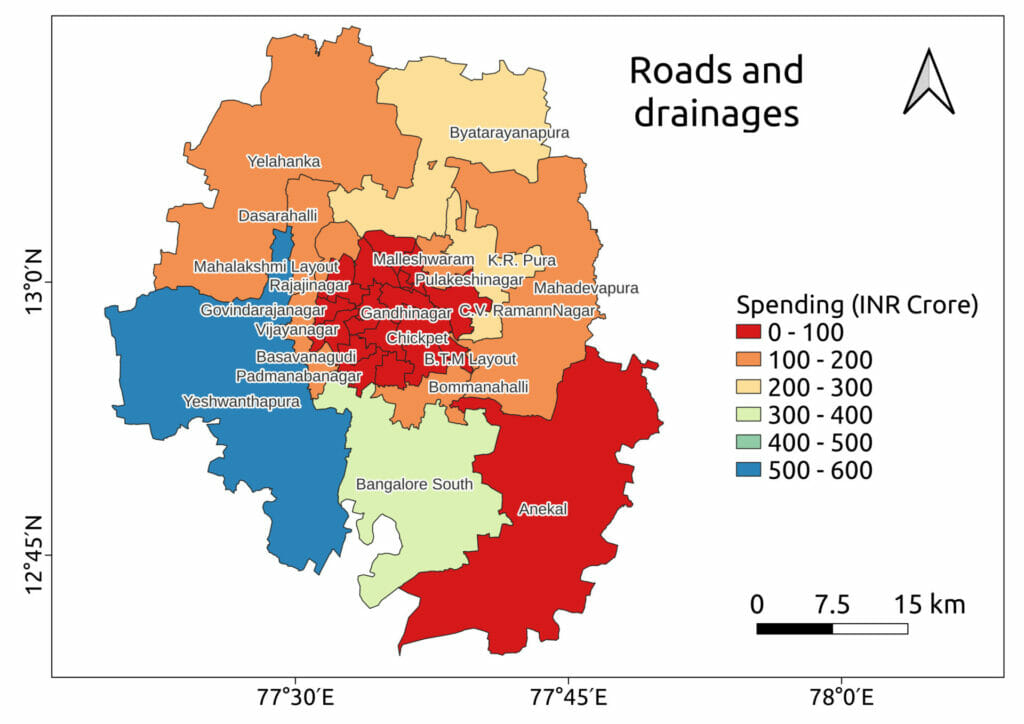
In absolute terms, while Yeshwanthpur, Rajarajeshwarinagar and Bangalore South saw spending of upwards of Rs 800 crore on their roads and drainage networks, other constituencies, especially in the North, have lagged behind. On average, Rs 430 crore each was spent in Yelahanka, Byatarayanapura and Hebbal constituencies in the past five years.
KR Pura and Mahadevapura, being part of the city’s IT corridor, did marginally better with Rs 600 crore on average being spent in each of these constituencies over the past five years.
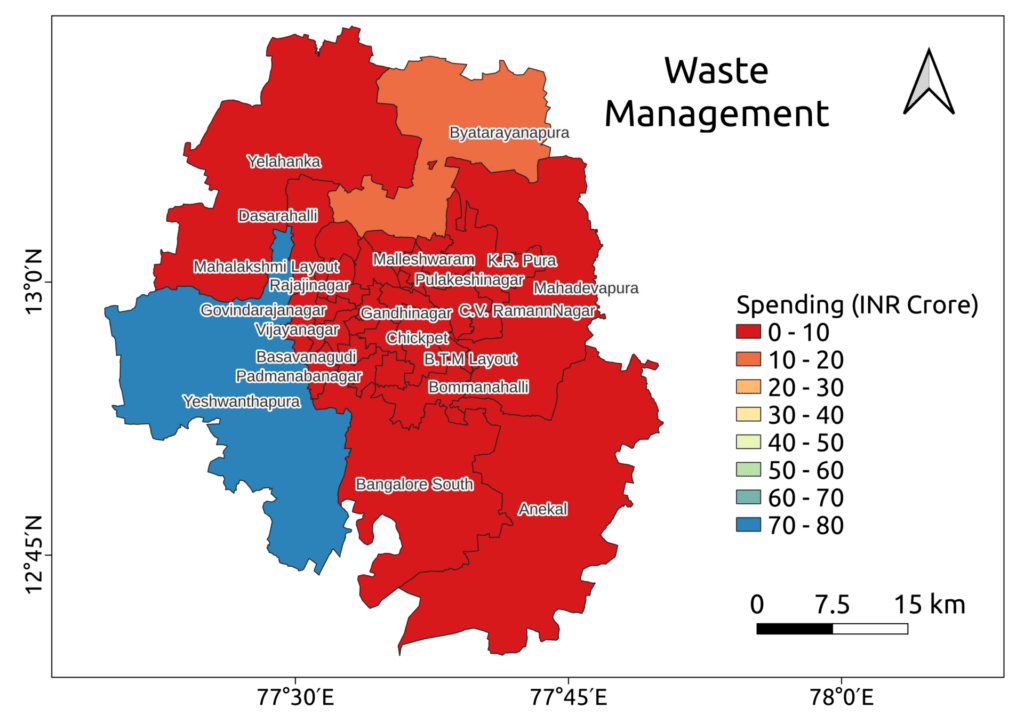
Rs 250 crore for Solid Waste Management
Solid Waste Management is an important function of BBMP, and there have been concerns about the body’s plans and execution. In the past five years, BBMP spent a total of Rs 250 crore on solid waste management ward-wise. In terms of constituencies, while the spending in Yeshwanthpur constituency was highest at Rs 73 crore, it was quite low in the rest of the constituencies. Only Byatarayanapura seems marginally better than the rest with Rs 18 crore. The map below shows the spatial distribution of spending on waste management across the different assembly constituencies.
However, solid waste management got Rs 877 crore from the non-ward expenditure. Given that waste composters, and processing units are not ward-level expenses, we need to factor this amount in when discussing the total expenditure on solid waste management.
Work orders for water and sanitation projects
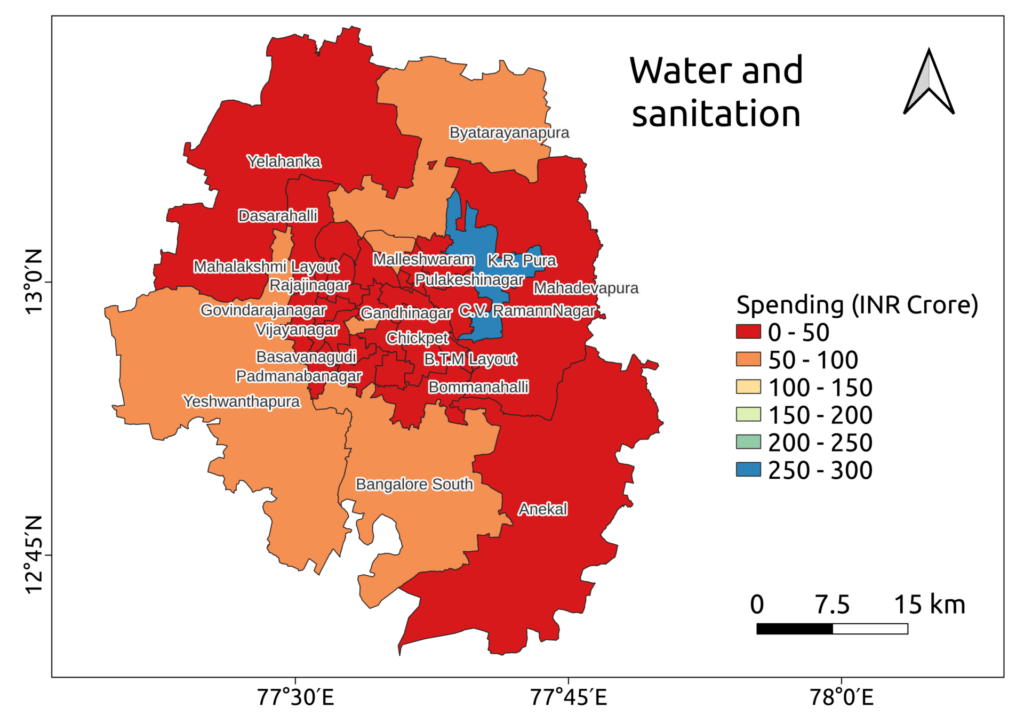
In the past five years, BBMP spent Rs 1,216 crore on water and sanitation. While BWSSB is the body that supplies water to most of the city and deals with sanitation and treatment, BBMP has to take on this role in areas where BWSSB is yet to reach. This includes having to dig borewells, provide clean drinking water through tankers, and connect sanitation to BWSSB’s lines, among other tasks.
At the constituency level, KR Pura got the most spending on water and sanitation at Rs 260 crore, which is more than 21% of the total amount spent in this category. The spending was poor in the rest of the constituencies. Among the rest, only Yeshwanthpura, Bangalore South, Byatarayanapura and Chamarajpet seem to have seen marginally better spending.
The spending in this category needs to be read carefully because less spending from BBMP on water and sanitation could mean either better BWSSB coverage in those areas, or poor water coverage from both needing BBMP to step in. More ground-level analysis is needed to get a better idea of these items.
Conclusion
It was observed that Yeshwanthapura, KR Pura, Rajarajeshwarinagar, and Bangalore South had the most spending allocation from BBMP, of more than Rs 1,000 crore each, compared to the other assembly constituencies, accounting for more than a third of the total allocation across all constituencies. It has to be mentioned that Yeshwanthapura and Bangalore South are among the biggest Assembly Constituencies in terms of area.
Govindarajanagar, despite being small in area, has seen a relatively larger amount being spent on its amenities when compared to other smaller constituencies like Basavanagudi or Shivajinagar and larger ones like Yelahanka, Byatarayanapura and Mahadevapura.
The spending in constituencies in North Bengaluru, Byatarayanapura and Yelahanka, has been middling in almost all categories. This could be because large areas of these constituencies fall outside BBMP’s jurisdiction. But that is true also of Yeshwanthpur and Bangalore South constituencies.
The spending by BBMP in the critical IT corridor of Mahadevapura, Rs 574 crore, which has seen explosive growth in population in the past 15 years, has been close to the average across all the constituencies (Rs 543 crore). This shows in the regular protests from citizen groups, who are forced to take to the streets to demand basic amenities like roads and garbage collection, and also face the brunt of flooding every year due to rains.
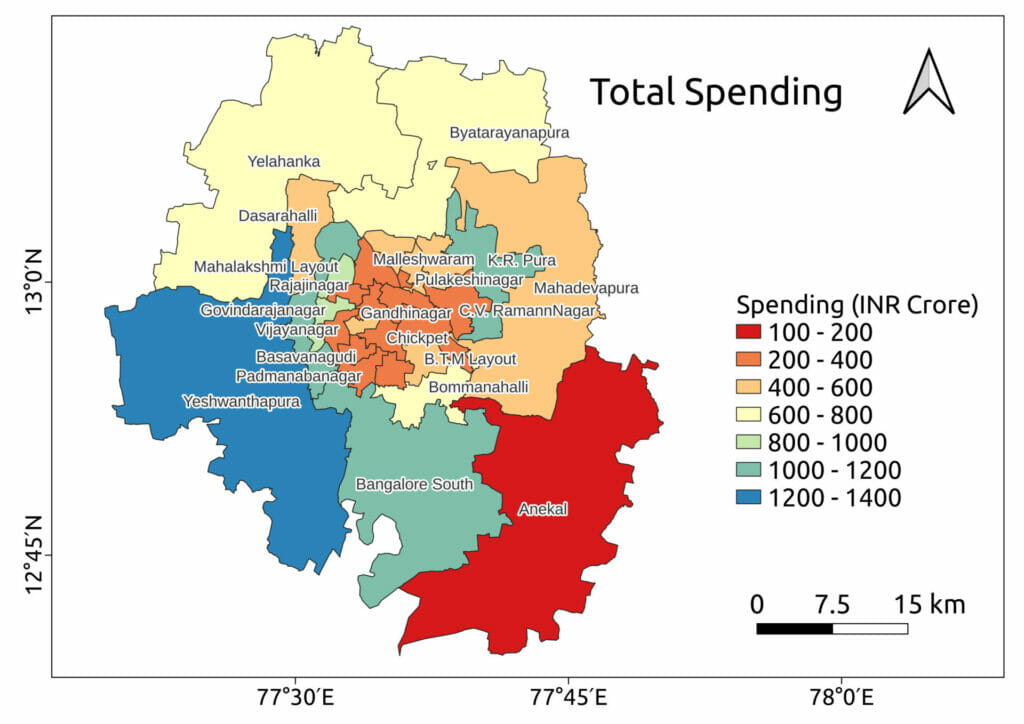
It can be seen in the above map that most of the assembly constituencies in the interior of Bengaluru had an average expenditure of Rs 200-400 crore in the last five years, while the constituencies at the periphery of the district got the most money.
This may be due to a couple of reasons. One, the city is growing and there is a need for development activities on the outskirts. And two, peripheral constituencies are much larger in area compared to the interior ones. Given the vast differences in size and population across constituencies, this analysis can be further expanded by normalising for the area as well as population.