On January 14th in Bengaluru, Hebbal dipped to the minimum temperature of the day at 6.04 am, Electronic City felt the minimum temperature at 6.18 am. Vidyaranyapura recorded the lowest temperature at 6.24 am, and Jayanagar as late as 7.10 am. Despite Hebbal being located only 16 km from Jayanagar, there was a significant difference of 1 hour 6 minutes when both areas recorded minimum temperature.
The same is true for rain too. It doesn’t rain in Whitefield, when it does in Jayanagar. So the preparedness is different for Whitefield and Jayanagar for a rainy day predicted by Meteorological Department. Ever thought about it?
With the city witnessing a spree of developmental activities, accompanied by a rise in pollution levels and a change in topography in last two decades, there has been visible variation in weather patterns across the city. Our observations are limited to mere passing remarks, because such micro-level data is not available in public domain.
Two young weather enthusiasts from the city have initiated the Citizen Weather Network that aims to capture real-time weather data from 30 locations in Bengaluru and make it freely available for public view over a web API.
With five stations already installed in different parts of the city, they have started tracking Bengaluru’s microclimate. These indigenously developed Automated Weather Stations (AWS) house sensors for recording temperature, pressure, humidity and rainfall.
Each weather station could cost less than Rs 50K
The initiative, the brainchild of Pavan Srinath, Head of Policy Research at Takshashila Institution in Ulsoor, started in the form of a blog – Know Your Climate. As Srinath puts it, the blog was an attempt to make a serious study on the climate change by analysing the existing data available in the public domain, and placing it before the public in a simpler way. In 2014, Saurabh Chandra, CEO of Razorfish Neev, joined hands with Srinath to bring the idea to fruition.
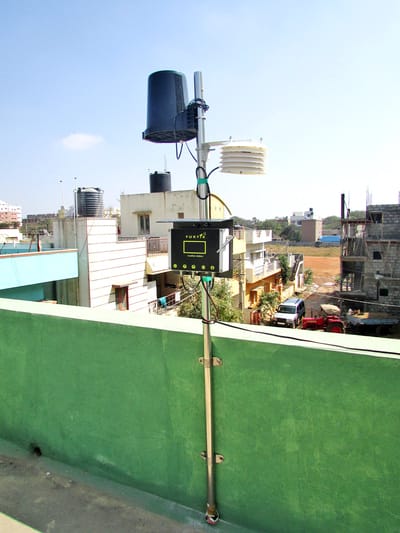
The Automated Weather Station installed on the rooftop of the house of independent technologist Thejesh G N in Electronic City. Pic: Akshatha M
Srinath’s attempts to gather statistics from Meteorological Department faced obstacles as the data collected by the department was not on public domain. Besides, very little data is collected about microclimate in cities by the Meteorological Department.
Srinath says, “We approached Rajeev Jha of Yuktix Technologies to work towards building an indigenous weather station. Jha accepted the challenge and within eight months the first two Automated Weather Stations were ready.” The pilot stations were installed on the rooftop of Srinath’s house in Jayanagar and Saurabh’s house in Hebbal. Each station was developed within Rs 50,000, much lower compared to the conventional stations that are built at a cost of Rs 2 lakh.
The modular weather stations are installed with sensors for measuring four factors – temperature, pressure, humidity and rainfall. While temperature, pressure and humidity sensors are housed within a radiation shield, the rain gauge is maintained separately. All these are connected to a main circuit board that logs all the data. The data is updated once in every three minutes which helps gauge the intensity of rain and weather pattern over time.
Jha vouches for the reliability of the data generated using the considerably cheap, but accurate sensors. “The instruments that we use in the station have been chosen after studying the specifications for an Automatic Weather Station published by the Indian Meteorological Department (IMD),” he says.
These sensors collect the sample of the environment every 15 seconds. As many as 12 samples are taken for each transmitted reading. “We provide the data in par with the standards set by the IMD and World Meteorological Organisation. I can assure data accuracy of +/- 0.1 degree,” he affirms.
How can microclimate data be useful?
Ask Pavan Srinath why this quest to compile statistics on microclimate and pat comes the reply. Apart from his personal interest to gather data, he says it gives better quality knowledge about the city. “If not today, this data will be of immense significance in the long run, say may be after 50 years. The data will help in better urban planning. For example, if some parts of the city consistently get more rainfall, such areas could be provided with better drainage and rainwater harvesting facilities,” he explains.
In 2014, BBMP estimated that loss due to rain and flooding in the city was Rs 50 crores. However, there is no scientific data to base their calculations on. In some areas, blocked drains lead to flooding even when there is less rainfall. Microclimate data could help identify such issues and fix them.
It doesn’t end there. Srinath adds: “By knowing about the climatic changes in one part of the city in advance, people who are planning to drive to that area can be prepared to deal with or avoid the situation. Just imagine, how convenient it will be for a person travelling from Peenya to Basavangudi, to know beforehand about the downpour in Basavanagudi.
Five stations and counting
The project which began as an experiment to gather microclimate data, has now taken shape of a community project with an objective to involve citizens in the process of tracking weather conditions and promote scientific temper. With the success of the beta testing process, a few like-minded people showed interest in installing weather stations on their roof tops too.
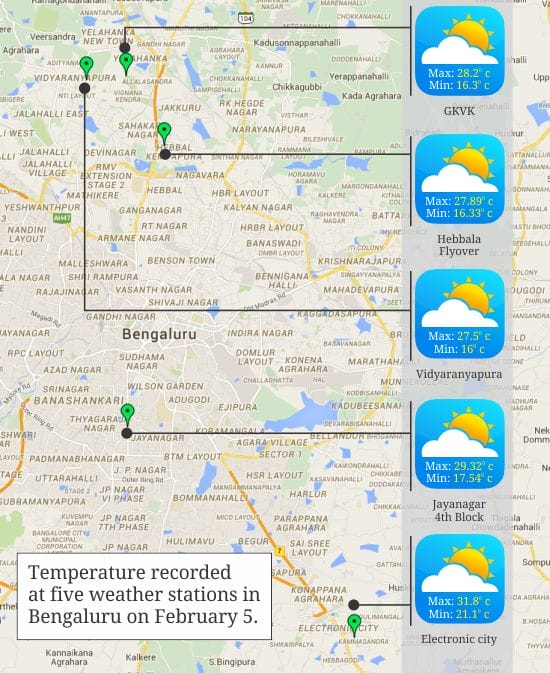
Apart from the two pilot stations, three more stations are functioning in the city—at the University of Agricultural Science campus, on the rooftop of a house in Vidyaranyapura and another in Electronic City. Srinath and Saurabh have received several requests to install stations and they are hoping to install at least 25 additional stations in 2015.
“We want all the data to be freely available to the public, so that any person interested in studying microclimate in Bengaluru can access it,” says Pavan. As he signs off, he expresses his wish to plug into Wunderground, one of the world’s largest weather networks.
Do you want a weather station?
Weather enthusiasts who want to be a part of the Citizen Weather Network, or wish to have a station installed on the rooftops of their homes can drop a message at their website or an email.
You can also contribute by sponsoring weather stations, funding the development of new modules, analysing the data and writing data stories, or joining the effort to visit schools to teach students about Bengaluru’s weather. Do have a look at the data collected so far here.
Related Articles
Weather station to water treatment, seminar discusses solutions to Bangalore’s problems
It’s all good news: Good rains, limited power cuts, less water woes!
Five years of rain water recharge can change the water map!
Rainfall in Bangalore over the last century: Has it really changed?
Hi, this is very good initiative and helpful for big cities. I reside very near to EC and was surprised to see that there is 5 degree difference with rest of the city. I went to the data you provided and found 21 degree is the average for the day, the minimum is 16.8 degree Celsius. I think you have wrong data on the graphics that you created.