The Karnataka budget for FY 2024-25 was recently released on February 16th. To better understand the nuances of the state budget, this expert analysis breaks down the various components for citizens to assess the fiscal health of the state. It also looks at corresponding figures for the financial year 2021-22 to explain what such an assessment reveals about the state’s finances.
The annual budget of the Government of India is an eagerly awaited event, almost at par with a cricket match. The eagerness and anticipation associated with the budget mainly stems from concerns regarding:
- Changes in tax rates
- Impact on the stock market
- Prices of different goods and services
In reality, there is much more to the budget than tax rates – it has ramifications in terms of the impact on different sectors of the economy:
- Import and export
- Interest rates
- Financing cost and security exchanges
- Investments and inflation
Read more: How citizens can use audit reports to be effective watchdogs
Nuts and bolts of a state budget
The budget indicates the priorities of the government: How, where and how much money it will spend.
State Governments’ budgets grab less headlines than those of the Union government, mostly due to the states’ limited financial influence, decision-making and taxation authority. Nonetheless, state budgets have a big influence on issues like job possibilities, incentives for various economic sectors, ways to fight poverty, and enhancing public infrastructure inside the state.
The budget is presented to the Parliament/State legislature, as applicable, which approves it after a thorough discussion.
Components of the Karnataka budget
The Government of Karnataka releases its annual budget outlay for the coming year, which is finalised by the Office of the Accountant General (Accounts & Entitlements) Karnataka. Two categories of accounts are prepared as indicated below:
- Appropriation Accounts: Covers the expenditure aspect alone in detail. In government accounting parlance, the expenditure details are captured up to the detailed head. (Numeric Classification). It is compiled on the basis of vouchers received from every nook and corner of the state.
- Finance Accounts: Capture both expected revenue and expenses, and are prepared in two parts: summarised statements and detailed statements. However, the level of detail is not as comprehensive as Appropriation Accounts. Receipts, disbursements, loans, advances, guarantees, investment, grants in aid etc. are covered.
State Finance Audit Report (SFAR)
The State Finance Audit Report, by the Office of the Principal Accountant General (Audit 1), covers in detail trends related to revenue and spending categories of revenue and expenditure, types of deficits, returns on investment, non-submission of accounts by autonomous entities, state debt profile, etc. Additionally, it provides a summary of how well the State Government complies with financial policies, guidelines, and orders. Below is a summary of the money received and spent by the state government.
The significant aspects of the SFAR for the Financial Year 2021-22, presented to the State Legislature on July 11, 2023, are summarised below:
| FY 2021-22 | Karnataka (in crores) | National (in crores) |
| G(S)DP | 17,21,336 | 2,32,14,703 |
| G(S)DP per capita | 2,78,786 | 1,46,087 |
- According to the Economic Survey of State for Gross State Domestic Product (GSDP) and National Gross Domestic Product (GDP) by Economic Survey of India, Karnataka, ranks fifth in terms of per-capita GDP.
- The largest contributor to GDP is the services sector, followed by the manufacturing sector.
- Karnataka was the first State to enact a Fiscal Responsibility Act (the KFRA 2002), which aims at ensuring fiscal stability, sustainability and greater transparency in fiscal operations using a medium-term fiscal framework.
- Consequently, the state has managed its finances well and exercises effective control over borrowings and spending.
- After consistently achieving a revenue surplus (net income > net expenditure) and a fiscal deficit (borrowing), well within the limit of 3% for a period of 16 years.
The state recorded a revenue deficit of Rs. 13,666 crore and a fiscal deficit of 3.84% of GDP in FY 2021-22.
This can be attributed to reduction in earnings due to the consequences of the COVID-19 pandemic.
The State Government has adopted best practices such as reflecting off budget borrowings, submission of utilisation certificates (a document that is used to certify that a particular loan or grant has been utilised for the purpose it was intended for) within stipulated time and containing outstanding debt (including off budget borrowings) below the norm of 25% of GSDP prescribed by KFRA.
Total expenditure
| Revenue Expenditure | Capital Expenditure | Total Expenditure |
| 2,09,428 | 52,083 | 2,61,511 |
| 80% | 20% | 100% |
| Revenue Expenditure | 2017-18 | 2021-22 |
| Committed expenditure on salaries, interest payments, pensions, subsidies, administrative expenses, etc | Rs. 1,07,732 crore | Rs. 1,67,354 crore |
| Increase | 55% |
A rise in committed expenditure affects the State’s ability to focus on development investment. For example, the Public Works, Ports & Inland Water Transport and Irrigation Departments spent Rs 4,087 crore on 1,208 projects, some of which have been incomplete for almost nine years.
Since most of these projects are funded from borrowings, the state has to bear the burden of servicing debts and interest liability without any benefit in terms of returns. Further, the likelihood of cost overrun is very high.
- Another issue of concern on the expenditure side is the relatively lower proportion of expenditure on Health and Education, vis-à-vis aggregate expenditure as compared with other states such as Tamil Nadu, Kerala, Andhra Pradesh etc.
- According to the Health Index published by the Niti Aayog for the year 2019-20 (Round IV), for the year 2018-19, Karnataka had a score of 57.93/100 whereas the other Southern States had scores ranging from 82.20 to 69.95.
- Karnataka’s performance in the year 2019-20 actually declined by 1.37% vis-à-vis its score for the year 2018-19. There is considerable scope for improvement in the state performance in the education sector too.
- The U-DISE report (School enrolment data — Ministry of Education) for the year 2019-20 published by the Government of India indicates that, at both Secondary and Higher secondary levels, Kerala and Tamil Nadu have far higher rates of gross enrolment ratio than Karnataka.
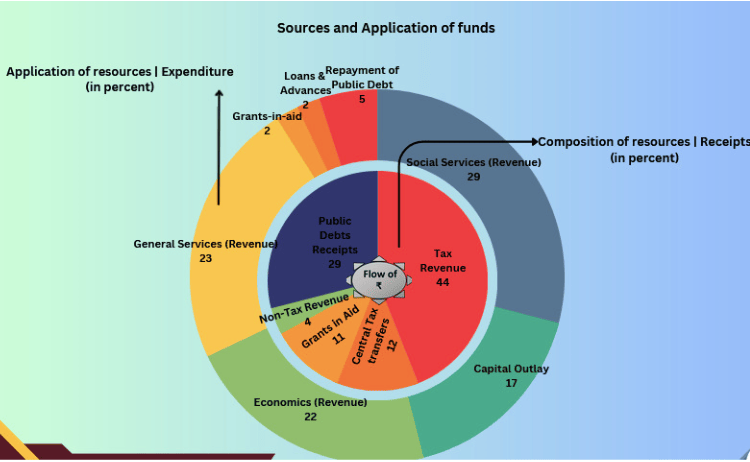
Total revenue
| Revenue Receipts | Capital Receipts | Total Receipts |
| 1,95,762 | 80,774 | 2,76,536 |
While tax revenue like GST and Excise duty exhibited a healthy growth rate there are two chronic areas of concern:
- Stagnant earnings on account of non-tax revenues, which includes mineral receipts, dividends, user fees etc.
- Paltry rate of return (less than 0.25%) on a total investment Rs. 68,256.68 crore in 98 public sector undertakings
The Government needs to take measures such as revision in user charges and fees for the various services provided by the departments e.g. housing, police, transport, forestry, tourism as well as address the issue of poor returns from Public Sector Undertakings (PSUs) by addressing concerns related to efficiency.
Capital receipts are composed mostly of borrowings i.e. public debt (market borrowings like LIC, NABARD, NSSF; Financial Institutions, etc.)
- Receipts of Rs. 8,0641 crore, which accounts for 99.84%
- Balance (Rs. 133 crore/0.16%) comprising recoveries of loans and advances, miscellaneous capital receipts like receipts from disinvestment etc.
The outstanding loan as on March 31, 2022 aggregated Rs. 35,329 crore and the amount recovered during the year was Rs. 127 crore. The recovery of loans and advances over the years has been unsatisfactory.
Non-implementation of important policy undertakings
Significant policy initiatives announced in the budget, such as Science and Talent search programmes, Artificial Intelligence, Research Translation Park, Tank bank for water security, soil health policy etc., were not implemented due to non-release of funds and delay in receipt of information.
Schemes for women
The Budget comprises two categories of schemes for the benefit of women:
- Category A: Women specific schemes with 100 % allocation for women, e.g. Interest subsidy for women through Karnataka State Finance Corporation
- Category B: Pro-women schemes (eg; scholarship for farmers’ children) with the allocation for women being more than 30 % and less than 100 %.
| Category | 2017-18 | 2021-22 |
| A | 5,901 crore (3.03%) | 5,415 crore (2.15%) |
| B | Rs. 82,156 crore (12.64%) | Rs.1,30,178 crore (15.47%) |
While the reduction under Category A schemes is certainly worrying, the impact of the increase under Category B schemes cannot be analysed in terms of its impact on women since neither the budget nor the expenditure is tracked in a manner that isolates the impact on women.
Recommended measures for State Government implementation
The State Government needs to implement the measures recommended by Fiscal Management Review Committee (FMRC), headed by the Chief Secretary:
- Revision of user charges
- Stamp duty and registration charges
- Better monitoring of non-tax revenue
- Recovery of loans and advances
- Prioritising completion of incomplete projects etc.
CAG recommendations:
- Review of the working of State Public Sector Undertakings incurring huge losses
- Taking appropriate action for disinvestment/revival/closure
To sum up, while Karnataka is to be lauded for efficient management of its finances, it needs to pay attention to issues such as inadequate return on investment in PSUs, poor recovery of loans and advances, low levels of non-tax revenue, augmenting capital expenditure and spending on health and education in quantitative and qualitative terms. The government acknowledged the findings and accepted the recommendations. The full report can be accessed here.
Explanation of terms
Numeric Classification: This consists of 15 digits 6 tier classification; the first tier starts with a 4-digit Major Head, which indicates the functions of the government like police, housing. The second tier is a two-digit Sub-Major Head, which denotes sub-function. The third tier involves three digits and is the Minor Head indicating programmes. Subordinate Head, Detailed Head, and Object Heads are the three tiers of classification, each with 1,2,3 digits. They denote the Scheme, Sub-scheme, and Object of expenditure, respectively.
Off Budgeting Borrowings: The borrowings by companies/corporations borrow from the market/financial institutions for implementation of various State plan programmes projected outside the State Budget. The borrowings of these companies ultimately turn out to be the liabilities of the State Government.
Revenue surplus: The excess of revenue receipts over the revenue expenditure
Revenue expenditure: Revenue expenditure includes items such as wages, devolutions to local bodies, financial assistance, etc., which do not result in the creation of capital assets
Capital expenditure: Capital expenditure includes expenditure on creation of fixed infrastructure assets such as buildings, roads, bridges etc.
[One way to be aware of issues of impropriety and poor performance in local government bodies and departments is to track the audit reports from agencies like the Comptroller and Auditor General of India (CAG). This article is the tenth in the Series: Understanding Public Project Audits by experts from the Indian Accounts and Audit Service]