Part 1 and 2 of the series looked at the transformation of Jayanagar from a quaint neighbourhood to a bustling commercial zone. Part 3 explores the street and transit networks in Jayanagar as well as its land use.
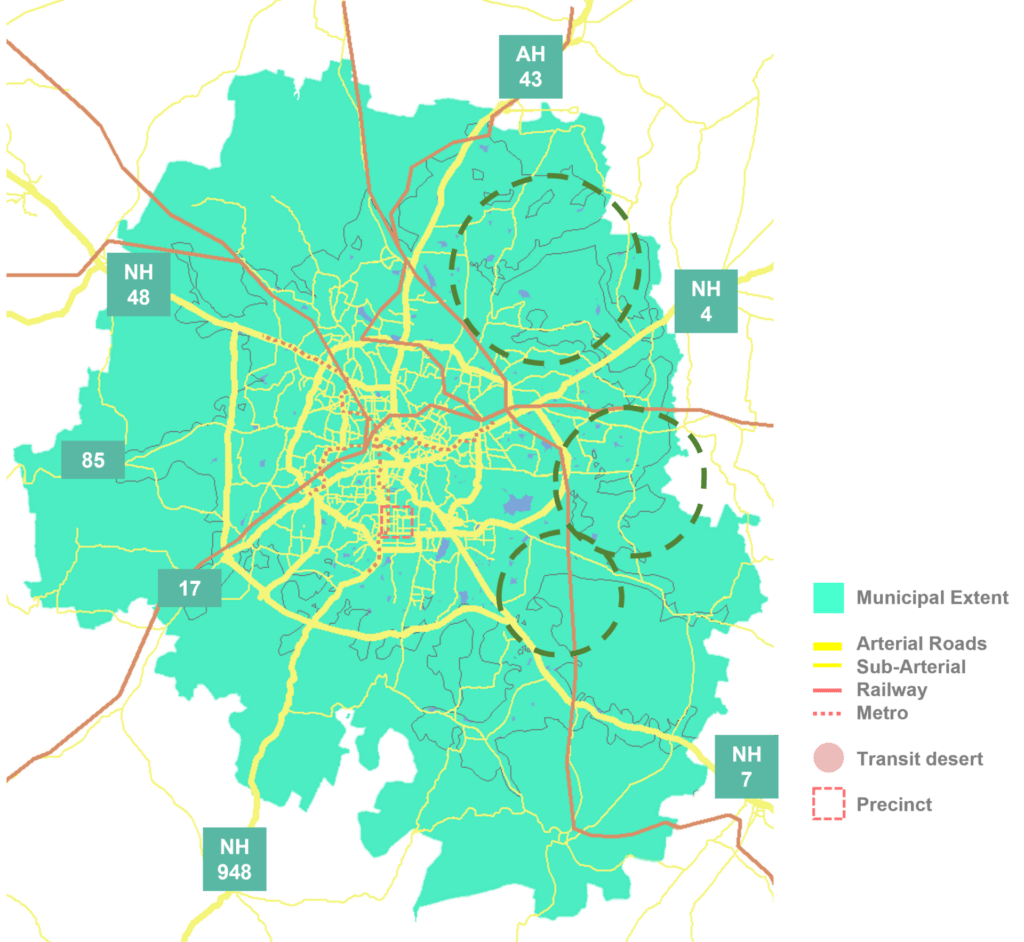
Figure 3.1 shows roads that connect Bengaluru to other cities. These are called arterial roads, which in Bengaluru form a radiating pattern known as the ring radial network. All the nine blocks of Jayanagar, which the precinct is part of, lie on either side of the road that emerges from the centre of the city and eventually merges with National highway 209 that connects it to Coimbatore in the south.
Figure 3.1, also shows other forms of transit networks in the city, like the railway and metro lines. The green metro line passes along the eastern edge of the precinct, encouraging residents of Jayanagar to use the available public transit to beat the traffic.
Jayanagar is a residential area, this means the locality consists of daily commuters working in the service sector who travel to work.
A visual analysis of Figure 3.1 shows that Jayanagar can be inferred to be an area with a developed street network. However, the map also reflects the sparsity of any kind of transit network in some areas of Bengaluru. These can be referred to as transit deserts that overlap with regions of the city that contain a large number of tech parks and offices. As a result, residents of Jayanagar face difficulties commuting to their workspace located in these transit deserts.
Road hierarchy within Jayanagar
Roads are categorised based on their function and capacity. The basic hierarchy of roads consists of: arterial roads that connect cities; sub-arterial roads meant for flow of traffic within the city; collector roads that manage traffic mobility by distributing traffic; and finally, local roads that provide access to buildings.
The network in Jayanagar forms an iron grid network, with roads intersecting at right angles. The precinct includes two important sub-arterial roads that form a transit and a commercial corridor each that run parallelly. 4th main has developed into the transit corridor ever since the overhead metro line began functioning in 2017. The 11th main road, which partially abuts the BDA commercial complex, has grown into the commercial corridor as response to the surge in land prices.
The rest of the roads are either local roads that provide direct residential approach or collector roads that move the traffic from the main roads to local roads. Figure 3.2 depicts this road hierarchy throughout the precinct.
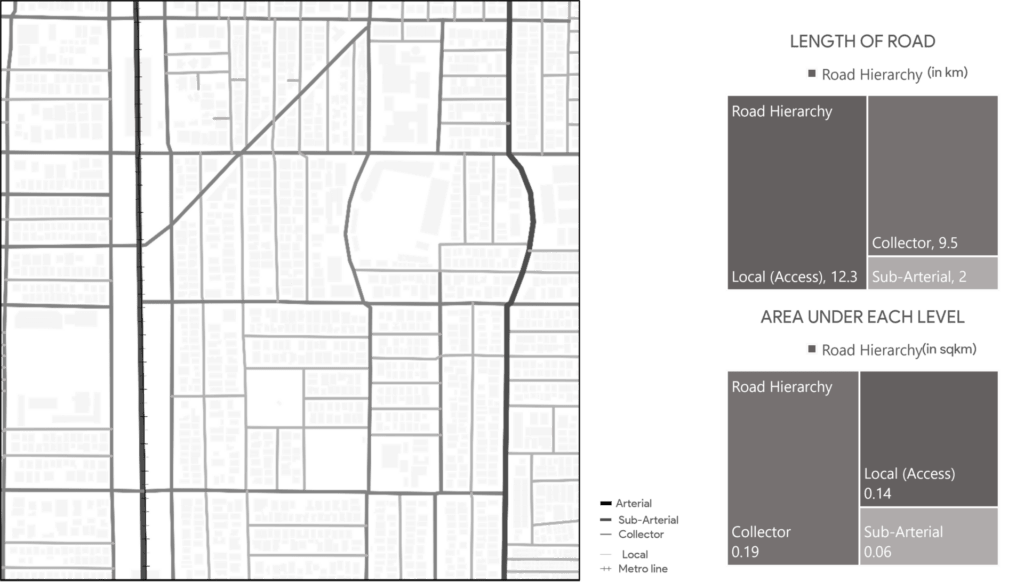
Figure 3.2 Distribution of types of roads: (L) The darker roads on the map highlight the sub-arterial roads (4th main and 11th main), which have important corridors along these areas. (R) The conceptual chart is split into rectangles sized by their order of roads by length and area. In terms of length, local roads take up a large percentage of the road network as it provides interior access. With respect to area, collector roads form the major segment, reflecting a proper hierarchy.
Network connectivity
To further analyse the road network, different concepts to measure connectivity have been used. Link-node ratio is an index to indicate connectivity. The more the number of roads (referred to as links) connected at an intersection (referred to as nodes),the better the connectivity.
As mentioned by Dill (2004), a perfect iron grid pattern has a ratio of 2.5. The precinct holds a 1.8 link node ratio, reflecting a good connectivity, but not a perfect iron grid network.
Another measure is the connected node ratio, which is an index to represent the number of nodes with only one link, which are commonly known as dead ends. Lesser number of dead ends lowers hindrance to move around.
The value of the connected node ratio is 0.98, indicating that the precinct has a negligible number of dead ends. An important observation is the node density value in Figure 3.3. This value is high due to the design of junctions in the precinct, where four road intersections are replaced by having a couple of three road junctions in the immediate vicinity. This increases the connectivity and decreases the vehicular conflict that otherwise emerges.
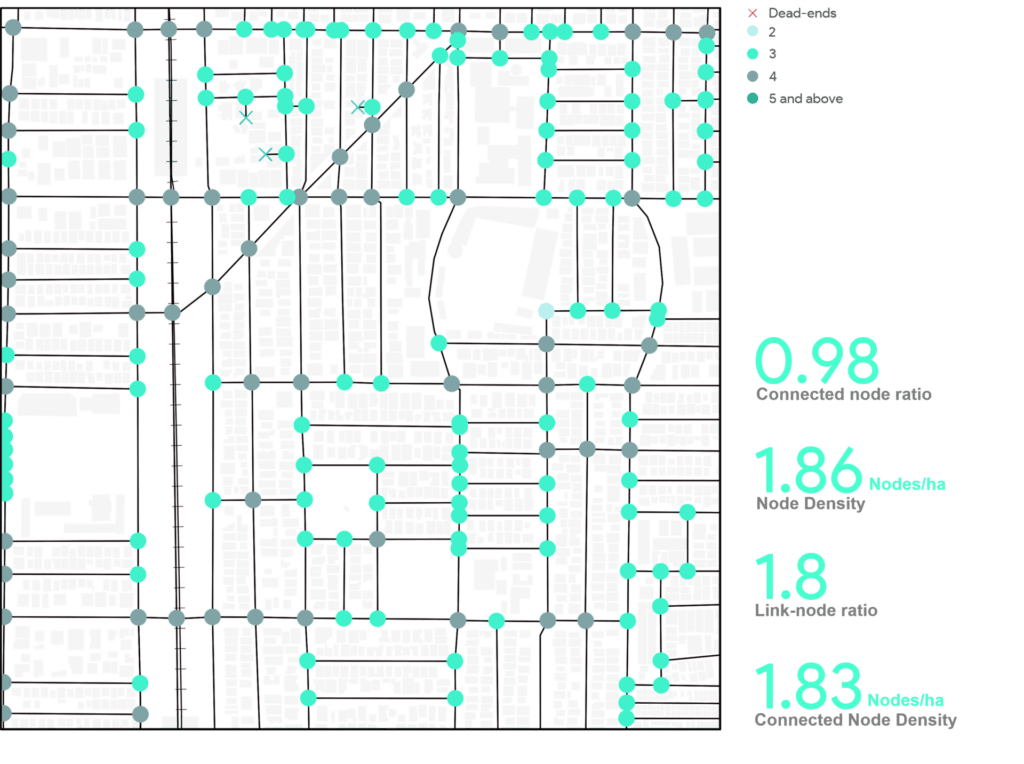
Figure 3.3 Analysing the connectivity with respect to its road crossings: (L) Indicates all the road junctions. The map suggests a larger number of intersections with three roads. (BR) The statistical values imply good network connectivity according to the standards.
Network accessibility
Accessibility is another important measure to analyse road networks. This essentially depends on the size of land parcels enclosed by immediate streets, called blocks.
Two aspects of blocks that in turn reflect accessibility for the residents are block perimeter and block area. The smaller the perimeter and the area, the easier the movement of pedestrians or vehicles. The average area of a block in the precinct is 8,000 square meters. However, the number of blocks with areas higher than the average block in the precinct are only a few.
Blocks with higher areas in the precinct contain continuous public parks, known as the green buffer, between 3rd to 4th and 4th to 5th Main road. This decision was taken by the governing bodies to decrease direct entry to the sub-arterial road due to high pedestrian movement around these public spaces.
A similar pattern is observed with block perimeter. The average of 422m of block perimeter lies on the higher side of a majority of the blocks. However, there is a gradual decrease in the number of blocks with the perimetre above the average value. Nonetheless, these average values lie significantly higher than the standard block size stated in the report by Handy, Butler, Paterson (2003).
Figure 3.4 includes a map with areas and perimeters of respective blocks. An example of poor accessibility is shown in Figure 3.4. Two points are chosen across the green buffer, one a very popular high school of the neighbourhood and another a residential block. In the current scenario, a student would have to travel 575m to the institution, which could have drastically decreased by direct connectivity that would encourage walking and cycling to and from school.
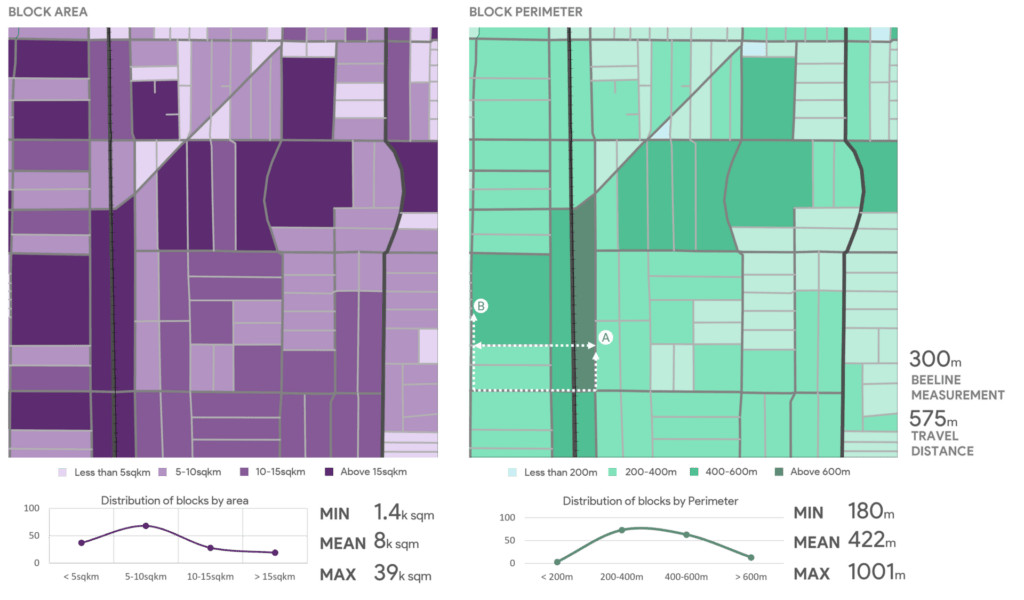
Figure 3.4 Analysing accessibility with respect to its block sizes: (L) Represents the block areas in categories of area. (R) Represents the block areas in categories of perimeter, with an example explained in the main text.
Road inventory
This section consists of the parameters of the roads that enable good traffic movement. Different types of roads, based on its function, follow different road widths. The distance between the land parcels on either side of the road is called the right of way (ROW).
Figure 3.5 is a detailed section through the 4th main. It is a sub arterial road with adjacent collector roads that include the green buffer of parks along these streets. The access to park areas are from collector roads on either side of the 4th main and the trees provide a large canopy over the sub-arterial road in between. These collector roads have a lot of public activity during the morning hours.
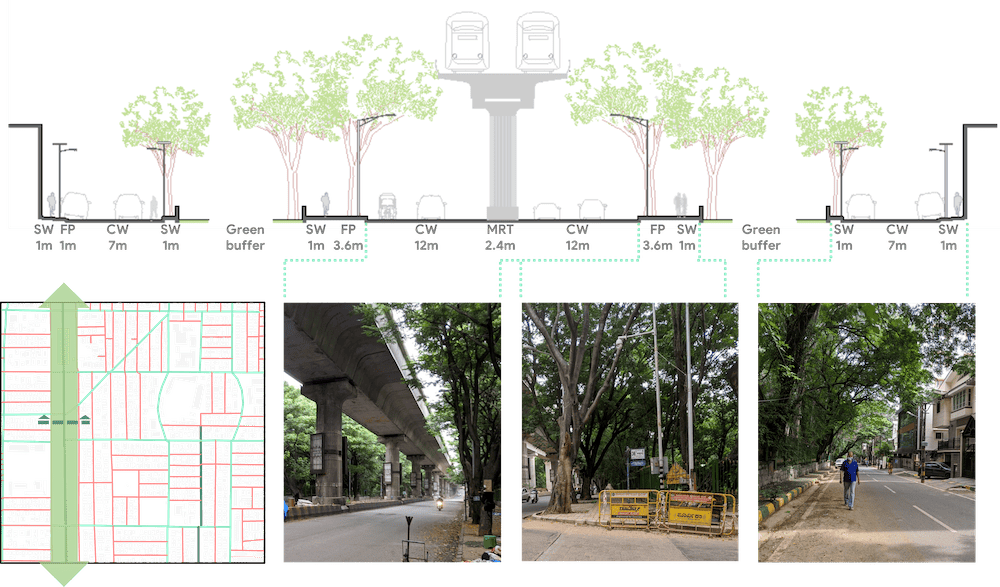
Figure 3.5: Detailed section through the sub-arterial road with overhead metro line: 4th main and the collector roads on either side: 3rd main and 5th main.
Overall, the distribution of road areas seems to align with hierarchy by their function. The medians in the precinct are limited to the sub-arterial and collector roads. There is 73% of footpath availability within the study area. The governing bodies have taken extra measures to stop two wheeler traffic by adding bollards on the footpaths.
Despite a high percentage of footpath provision, it is inconsistent and is disrupted by other infrastructure facilities. Figure 3.6 summarises these provisions through maps. A discrepancy is noted in the 10th main road. This one is as wide as the sub-arterial road. Developed with tree planters, special street lights and extremely wide footpaths.
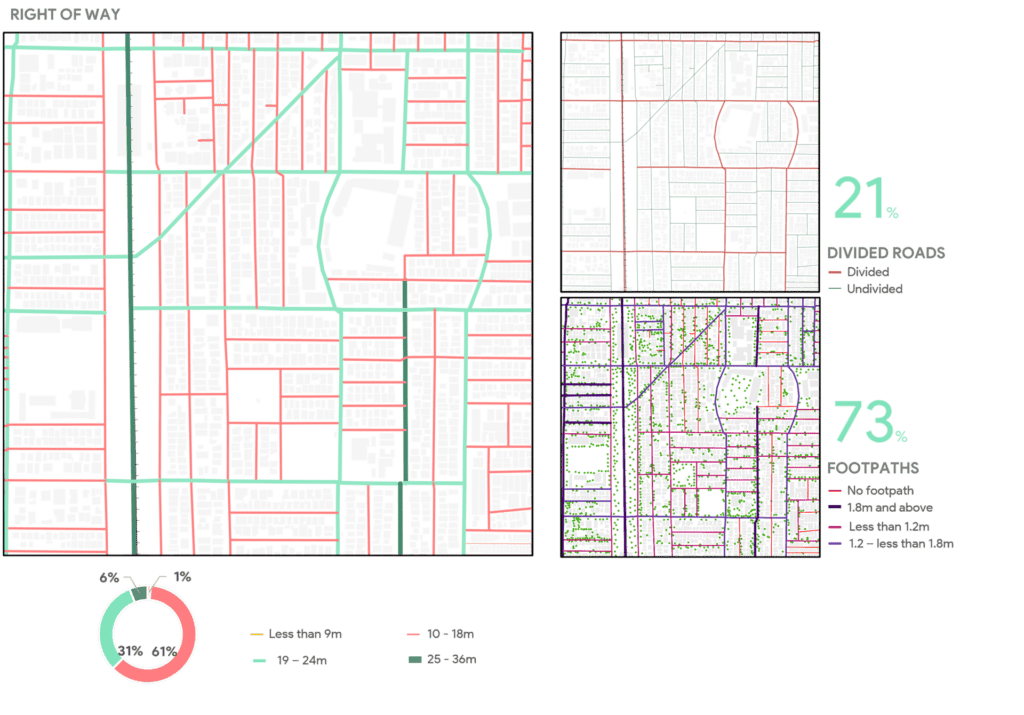
Figure 3.6 Examining the right of way and provision of medians and footpaths: (L) Map of road network in Jayanagar colour-coded according to the right of way. (TR) colour-coded on the basis of divided roads by provision of median. (BR) colour-coded according to the provision of footpaths and their widths.
With the city centre right within the study area, street activity, spillovers and encroachments are the highest around the commercial block. Figure 3.7 shows the spillovers of commercial activity, a common practice on narrow streets that have been redeveloped to accommodate medium rise buildings for commercial purposes. Religious centres also have a high public bustle.
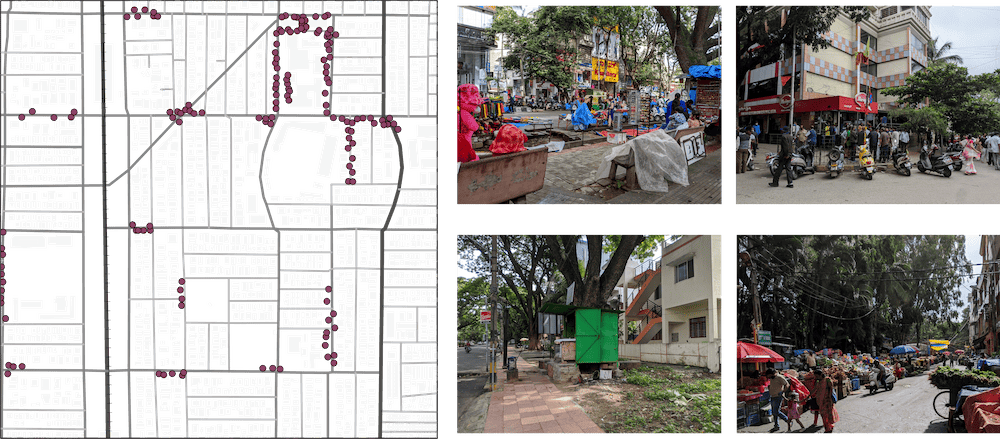
Figure 3.7 Documenting the street public activity: Dense on-street activity around commercial and religious zones. The cross streets are where street vendors locate their business.
The streets of Jayanagar are one of the few exceptions in a country dominated by organic street networks. The road network tries to be a consistent grid iron pattern with good connectivity. Further, the neighbourhood has become accustomed to organic development along these roads over a period of time and it also reflects the vibrancy of Indian streets.
Changing built form: Analysing the built form and land use
Context: As per Bangalore Development Authority’s (BDA) Revised Master Plan of 2015 (2007) , Bengaluru has been divided into three rings as illustrated in Figure 4.1. Jayanagar falls in Ring II, which is moderately developed. However, the locality has witnessed a lot of development owing to its proximity to the core of the city, well developed street network, and availability of working metro lines. This concept of rings has been removed from the proposed draft of BDA RMP 2031 (2018), and is only used to position the precinct relatively within the city and its amenities.
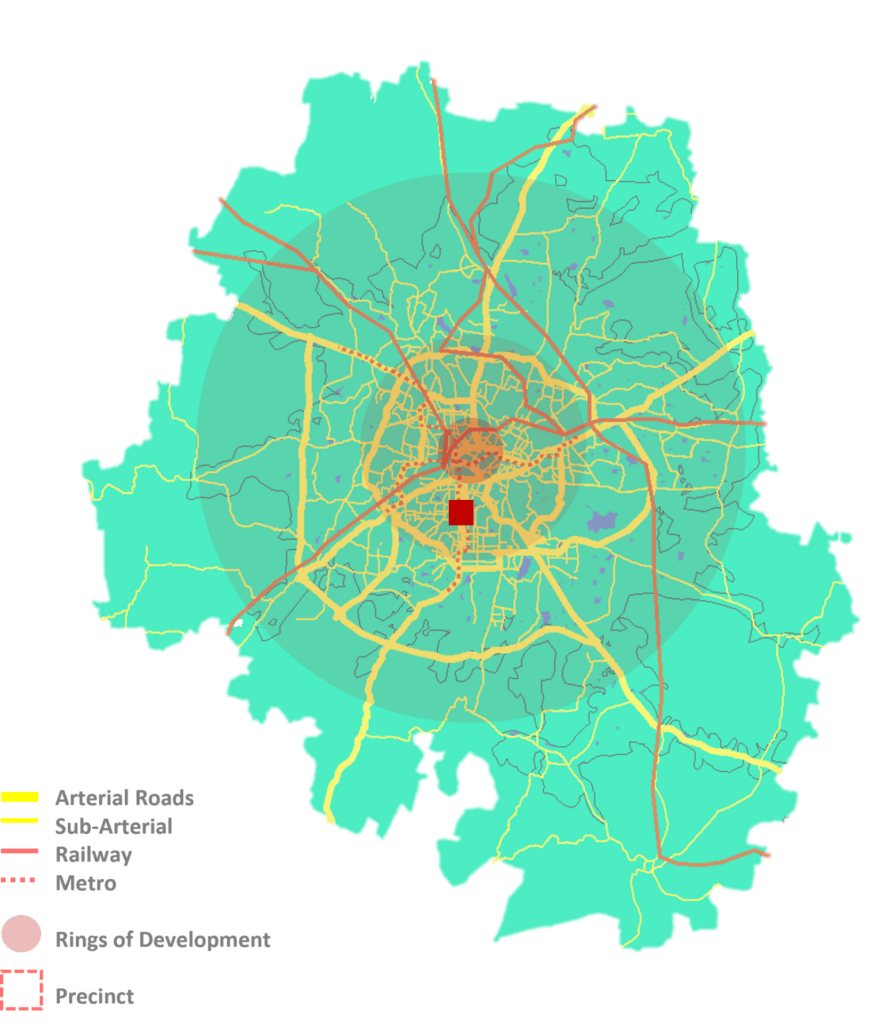
Figure 4.1 The precinct in the context for the city: The local planning area is conceptually divided into three concentric rings of development. Jayanagar, represented in a red square, lies in the second ring.
This development reflects in the property prices. In comparison to other localities in the surroundings as shown in Figure 4.2, Basavanagudi and Jayanagar have high property prices. Both these areas have other similarities, they have a planned grid iron layout, accessible metro line and are the city’s commercial nodes. However, further observations indicate that Jayanagar has a higher commercial demand due to more retail chain outlets due to difference in demographics.
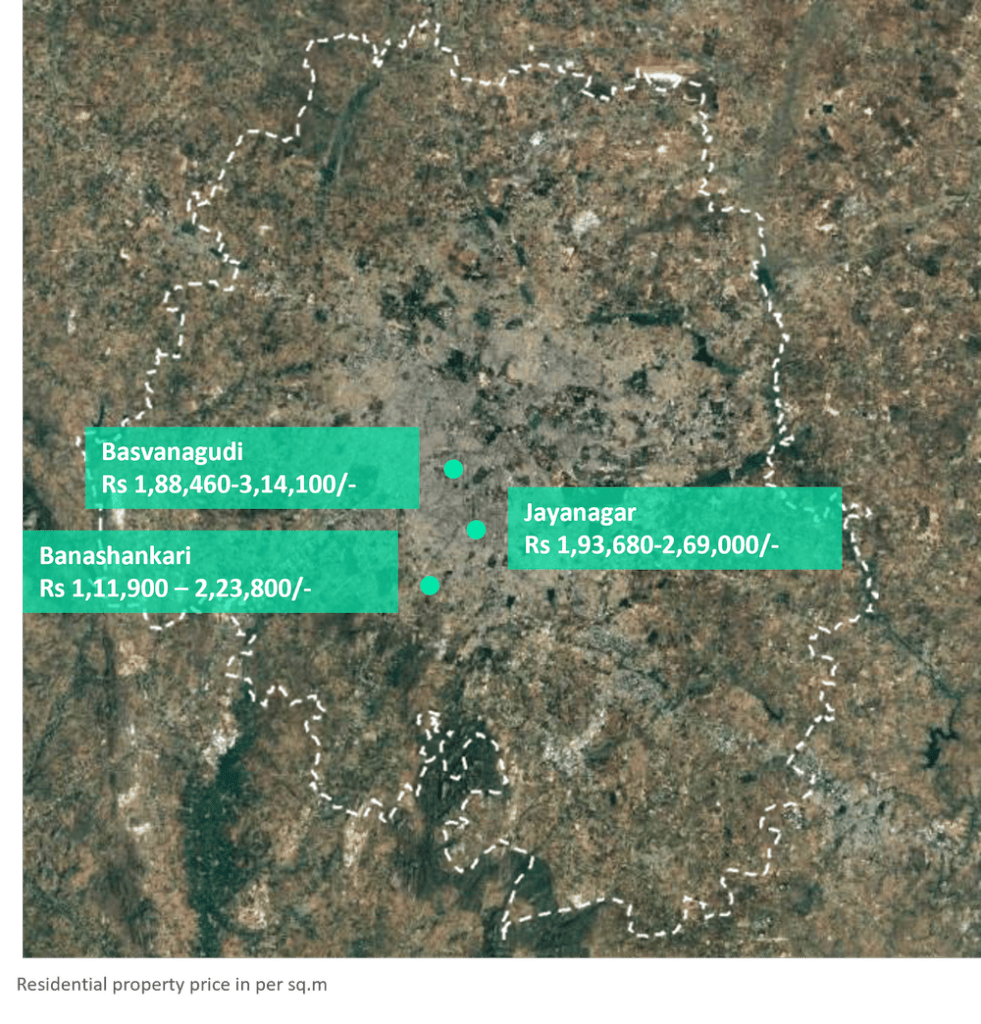
Figure 4.2 Residential property prices in Bengaluru. Comparison of residential property prices in Jaynagar and the localities in vicinity: Basvanagudi and Banashankari.
There is a list of key determinants that have driven the property prices in Jayanagar as mapped in Figure 4.3. The BDA has developed commercial complexes in many localities in Bengaluru. Jayanagar BDA shopping complex, built in the 1980s, is one of the most popular in the city.
Several empirical studies have shown high capacity transit like the metro line leads to increased land values in the vicinity (for example; Mathur., 2008; Gibbons & Machin., 2005). Another mass transit addition to the locality is the Bus Terminal , a popular mode of transportation in Indian cities, offering last mile connectivity to residents and visitors.
The green buffer along the 4th main road (also known as the Rashtriya Vidyalaya Road) is a long strip of parks and open spaces that adds to the quality of life and therefore reflects the high demand of the area.
The numerous institutions at an accessible distance, including higher secondary schools coupled with a few primary and undergraduate schools, makes it accessible to the young residents.
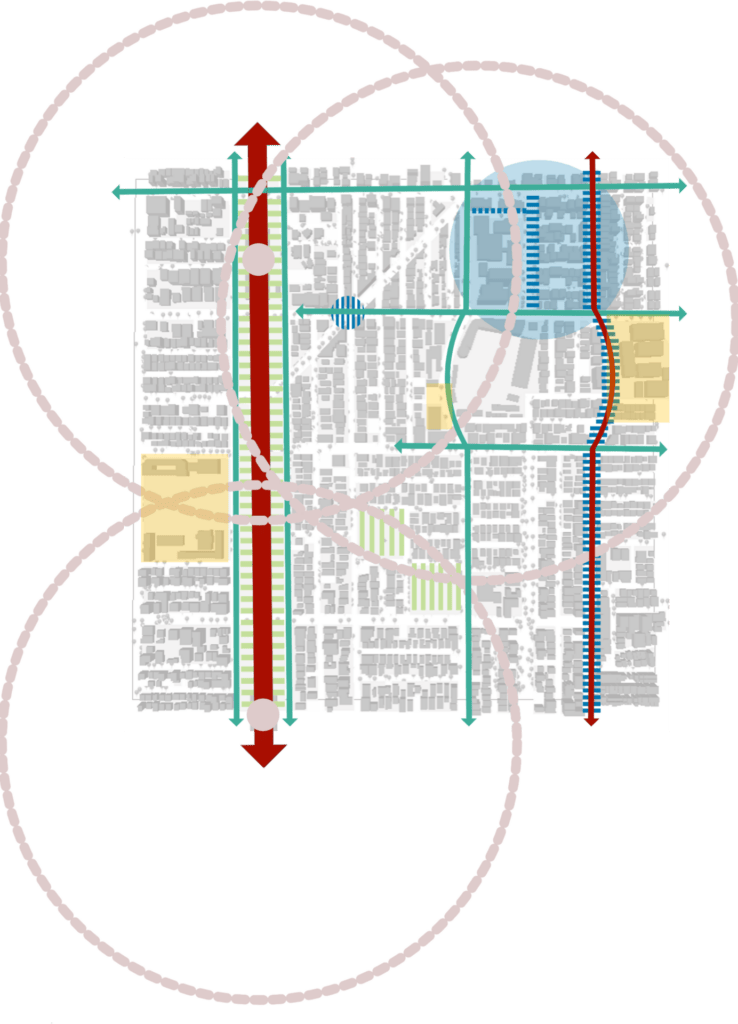
Figure 4.3 Spatial relationship Diagram: The thick red line is the transit corridor with the overhead metro line running along it. The thin red line on the west represents the commercial corridor. Other blue lines show commercial influence. The green lines indicate the green and open spaces within the precinct. The light pink circles represent the transit stations and the 500 metre walkable access around it.
[This article has been republished with permission by the author and with minimal edits]
Not to talk about the planned Chandigarh or Mysore, even a place like Faridabad has well-defined sectors, that is, land is aquired by government, sectors are cut, roads are planned in iron grid formation, with residence, market, complex, park and other civiv amenities and then people buy the land and build houses. Same in Greater Noida. But cities like Gurgaon (atleast htye have DLF) and much worse Bangalore, is a un-planned disgrace.