Part 1 and 2 of the series looked at the transformation of Jayanagar from a quaint neighbourhood to a bustling commercial zone. Part 3 explored the street and transit networks in Jayanagar as well as its land use. Part 4 looks at the increase in Floor Space Index (FSI) and building usage.
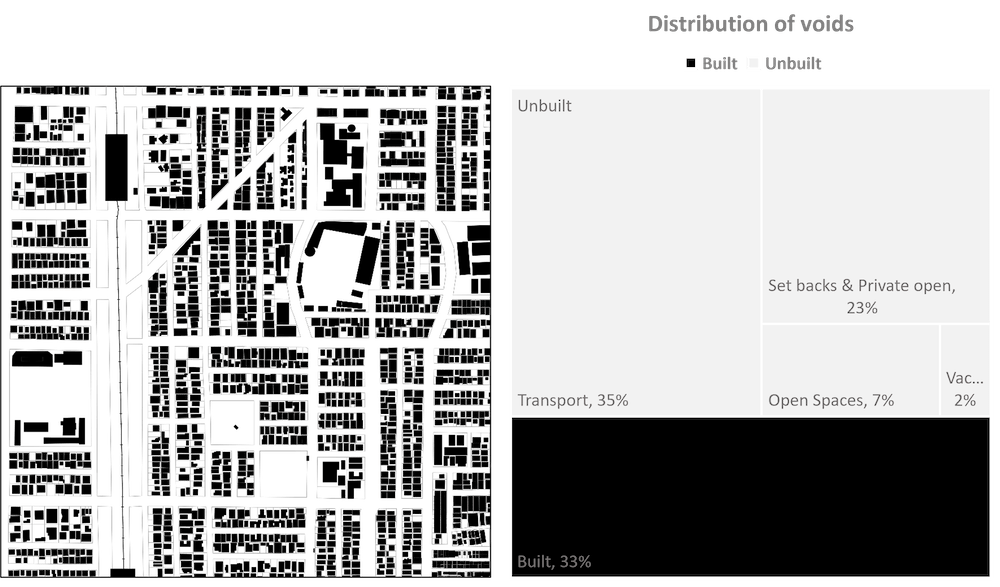
Figure 4.4 The footprint of the built environment in contrast to open spaces: On the left is the figure ground map of building footprints, plot lines and unbuilt spaces. On the right is a categorical representation, where the built and unbuilt areas are segregated.
To analyse the precinct’s response to the demand, the first method chosen is the figure ground. A figure ground map shows the relationship between built and unbuilt in a binary colour code. Figure 4.4 displays 67% of the precinct is unbuilt. The proportion is better understood when the solids, representing the built area, and voids, representing the open unbuilt spaces, are segregated as shown on the right side of Figure 4.4.
The unbuilt area is mainly used for road transportation. The number of large open spaces fall within the private plots. The available public open spaces is 7.5 square metre per person, which is lower than the minimum standards of 12 square metre per person, as stated by the URDPFI guidelines (2015).
Built fabric and urban grain are terminologies to explain the pattern of plots by their figure ground map.
The footprint in Figure 4.4 shows the built fabric is fine grain and homogenous, suggesting detached independent housing, i.e. villas and bungalows. Only 2% vacant plots in the precinct imply a saturated footprint.
Floor Space Index
With a meagre number of vacant plots, the market demand is met by an increase in Floor Space Index (FSI).
FSI is defined by BBMP Building Bylaws (2003) as a quotient obtained by dividing the total covered area of all floors by the area of the plot. A higher FSI fetches more floor area or more floors to the building or a larger area on the ground or both.
The newer developments in the locality use higher FSI by increasing the number of floors and ground coverage. Figure 4.5 illustrates the changing FSI in Jayanagar, which has two-floored independent houses closer to the green buffer and four-floored apartments, and commercial spaces as it nears the commercial spine of 11th main road.
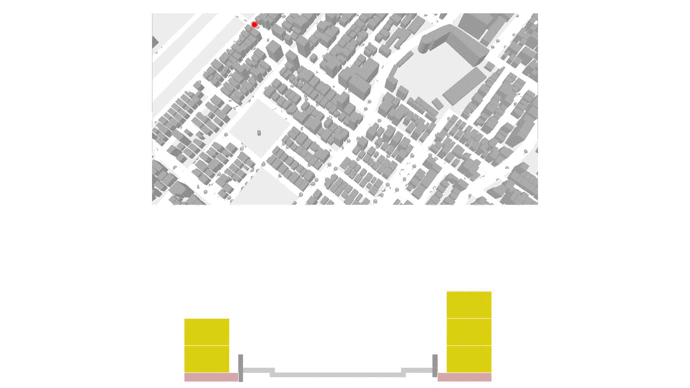
Figure 4.5 Changing building heights and usage: The red dot moves on 33rd Cross Road, a street that has witnessed a transformation under the influence of close proximity to the BDA complex, Metro Station and Bus Terminal. At the bottom are the building heights at each point of the red spot, indicating the number of floors and colour-coded by their building use: yellow represents residential, blue represents commercial, and red represents institutional.
The net FSI, the ratio of total built area to the total plot area of the precinct is 1.4, which is a low value, however, the highest FSI in the area is 5.5. To understand what plot-use has a higher FSI, dwelling units per plot, FSI mapping, and non-residential plots is shown in Figure 4.6. The plots with higher FSI do not fall under the residential plots, therefore, residential plots are not the ones with a comparatively higher FSI and it is the commercial spaces that are exploiting the higher range of FSIs in the neighbourhood.
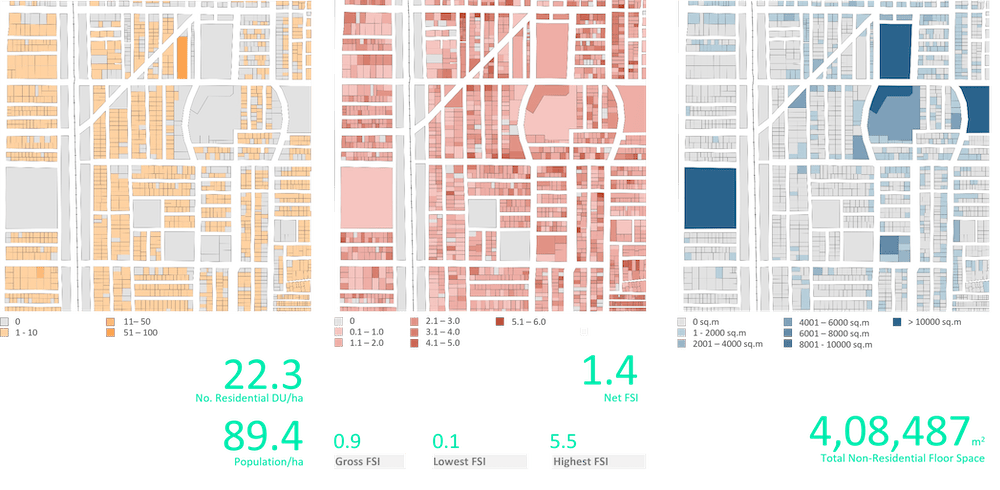
Figure 4.6 Identification of plot use that has high FSI: On the left is the map representing the number of dwelling units (DU) per plot for all residential plots. The increase in DUs on each plot is represented by a gradation colour. At the centre is the map representing FSI for each plot. Increase in FSI is represented by a gradation colour. On the right, is the map representing plots used for non-residential purposes. The increase in area of each plot is represented by a gradation colour.
Analysing what is a high FSI in context to Jayanagar, a statistical tool called frequency distribution has been used to understand the number of plots that fall under a particular range of FSI. A graphical representation of the frequency distribution in Figure 4.7 shows that newer developments are exceeding the permissible FSI of 3.25, stated by the Revised Master Plan 2015 Bangalore (2007).
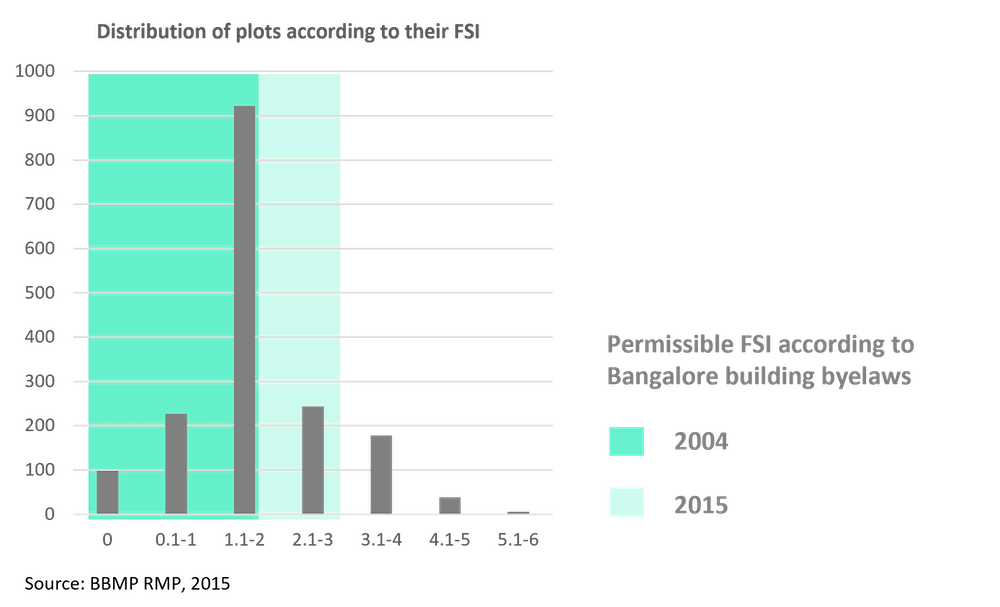
Figure 4.7 FSI in the precinct: A graphical representation of the number of plots within a range of increasing FSI. Dark green denotes the permissible FSI in 2004 and light green denotes the permissible FSI in 2015.
Building typologies
To understand building typologies using their FSI, Figure 4.8 consists of a built form matrix. The detached independent housing was a standard typology in Jayanagar until a decade ago. However, newer typologies have emerged in response to the growing demand. Row houses, built on the smallest plot size in the precinct use up to 92% of ground coverage and go up to four floors high. Larger plots have redeveloped higher multi-dwellings using the same ground coverage as independent houses. Plots with a commercial influence in the surroundings have redeveloped into retail or non-retail spaces.
The smallest plots that have commercial usage are generally used for retail purposes. These plots use 100% of their ground spaces and are four floors high. The larger plots use up to 75%–77% of the ground space and are six floors tall. The BDA shopping complex is an exception and has developed a large building with eight floors of commercial space.
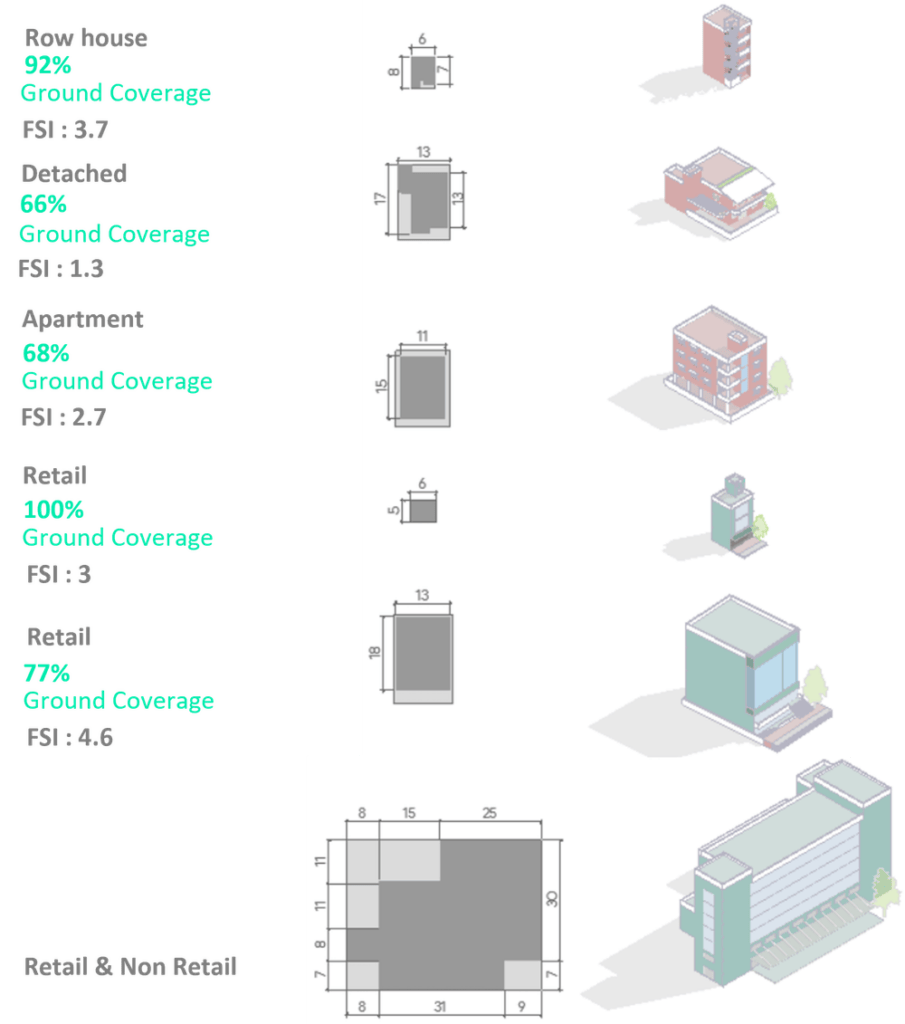
Figure 4.8 Building typologies: The first column includes the details of each typology, their ground coverage and FSI. The second column includes a plan to understand how the building typologies use their ground floor. The third shows renders of typologies to relate the building height with the plot boundary.
Land use
Another important aspect in the precinct’s response to the demand is the spatial spread of commercial use. The popular BDA complex has made the area a hub for commercial spaces. The land use mapping on the right side in Figure 4.9 shows that the commercial activity has precipitated into the local/access roads. On comparing it with BDA’s proposed land use master plan 2031 on the left side, in Figure 9, we can see that the governing bodies want the commercial activity strictly towards the main roads to maintain the residential character of the precinct.
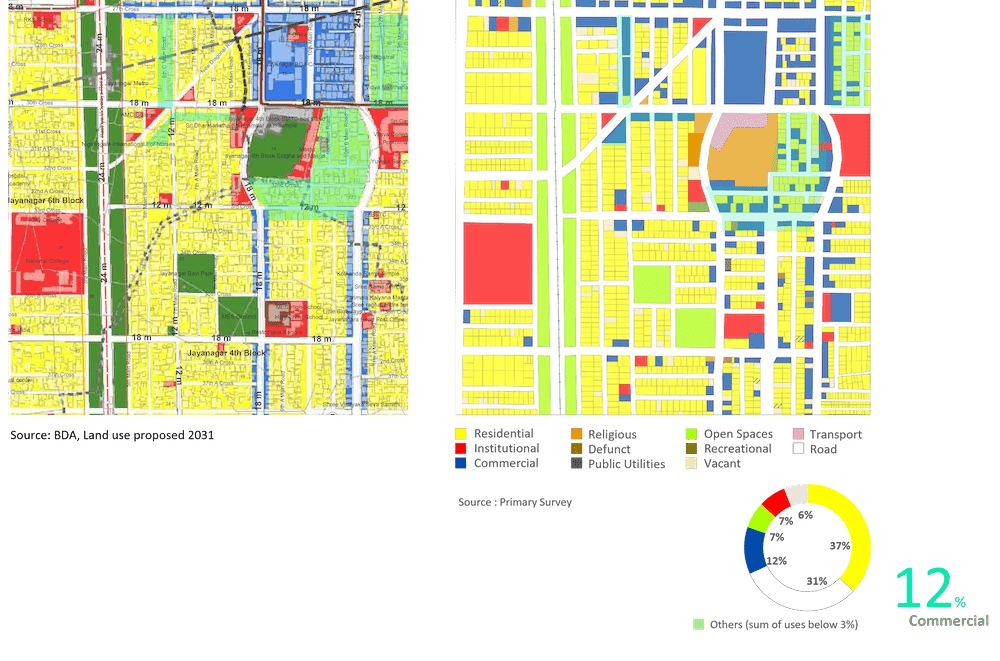
Figure 4.9 Identification of plots with commercial buildings that are not as per the Master Plan’s plot use: On the left is the proposed land use BDA Master Plan 2031 to compare with the existing land use shown on the right.
Building use
To analyse whether this commercial spread is evident, a graphical analysis through pixel distribution is done in Figure 4.10. The pixel distribution diagram was done by dividing the study area into 50 sqm squares and was assigned with the colour representing the predominant use of the building. On rearranging these pixel units, it shows that the growing secondary predominant building use of commercial purposes is noteworthy.
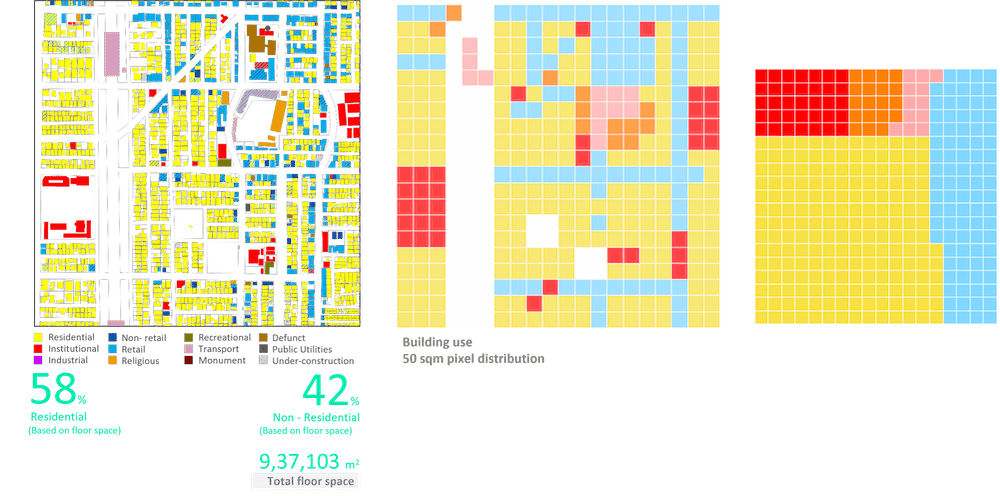
Figure 4.10 Analysis of building use: The leftmost map shows existing building use. At the centre is the 50 sqm pixel representation of building use. On the right is a rearranged diagram of the same pixels to understand the dominance of commercial use in buildings.
With only 15% of public land as shown in Figure 4.11 and meant for public utilities and open spaces, the exception being the BDA commercial complex, the responsibility for responding to and coping with market demand falls to the private landowners. Therefore, the transformation seems to be contagious. The building typology map shows the increasing apartments in the precinct along with the commercial spread that has been analysed until now.
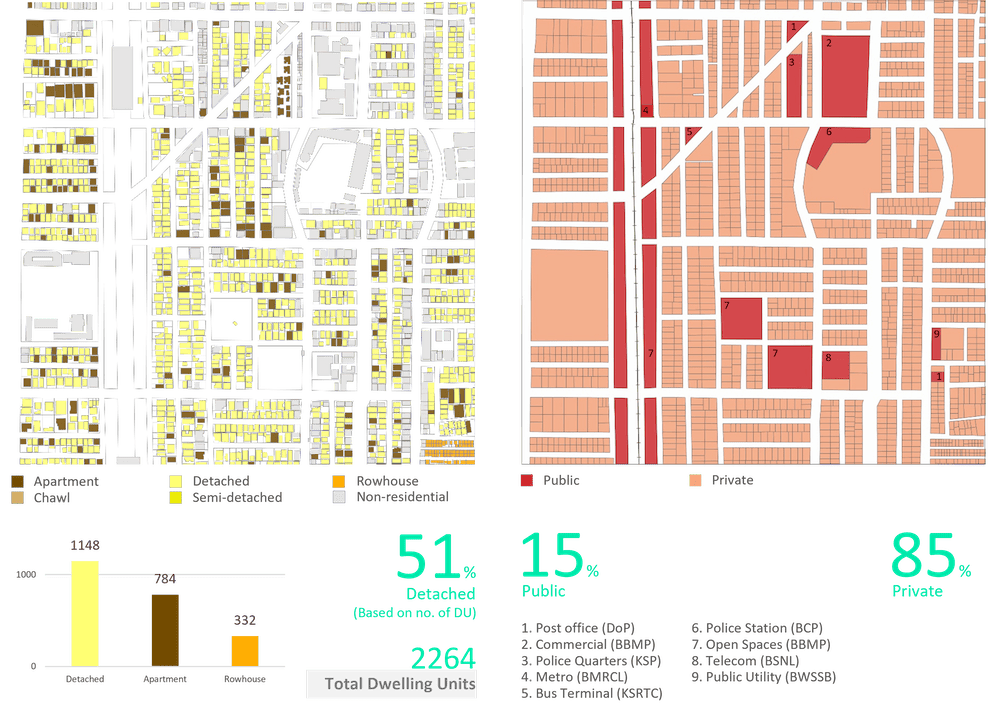
Figure 4.11 Analysis of building use correlation of residential buildings to their plot ownership: On the left is the map of residential building typologies. Yellow represents the independent houses, brown represents apartments and orange represents row houses. The greyed-out building footprints are used for non-residential purposes. On the right is the map of plots, coded in red for public ownership and in orange for private ownership.
Figure 4.12 shows only 3% of parking spaces are available on ground floors. This shortage of parking in both residential and commercial buildings within the precinct hinders the development of Jayanagar. While multi-level parking is available in the bus terminal for the commercial area, it fails to encourage pedestrian movement from there. The increasing number of apartments also necessitates self-sufficiency in meeting their residents’ vehicular requirements to reduce street parking.
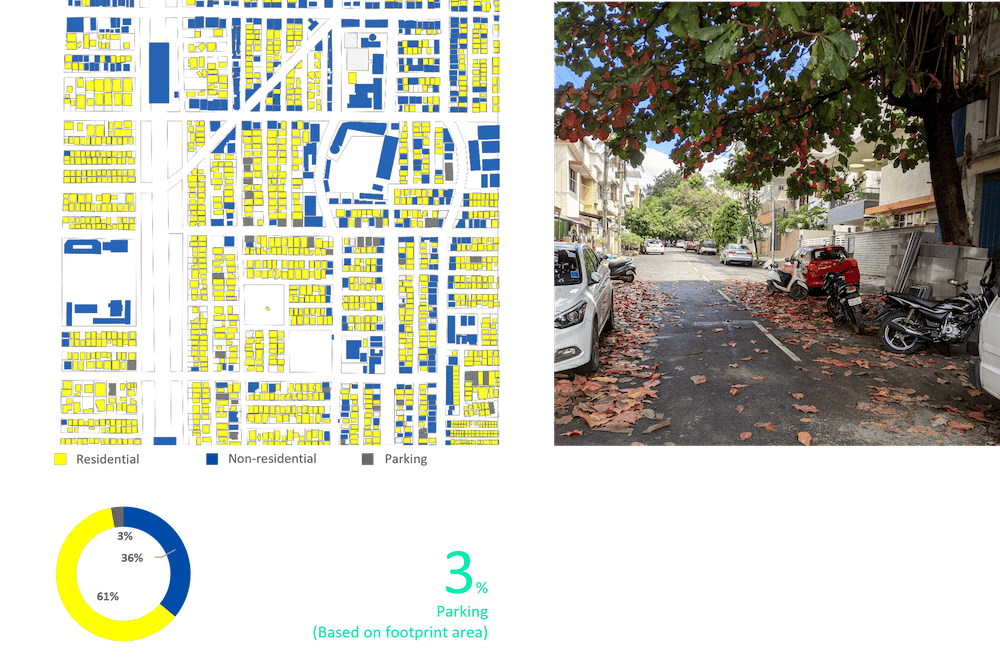
Figure 4.12 Deficit parking: The map represents how the ground floor is used within the precinct. Yellow represents residential, blue represents nonresidential, and dark grey represents parking.
Jayanagar is an old neighbourhood with high demand, and in response it is undergoing redevelopment. The redevelopment results in change in building typology, building use, ground coverage and building height. With most plots owned privately, this reaction is inevitable.
The trend of commercial spread will lead to higher surge in property prices. The natural progression for the built form within the precinct is to amalgamate to form larger apartments or commercial spaces.
The precinct is currently undergoing redevelopment, which is illustrated in the pictures of Figure 4.13. By referencing our previous exercise on understanding the street network, we can recognise that taking proactive measures to address parking will enable the creation of more efficient street networks to support higher-density urban development in the future.
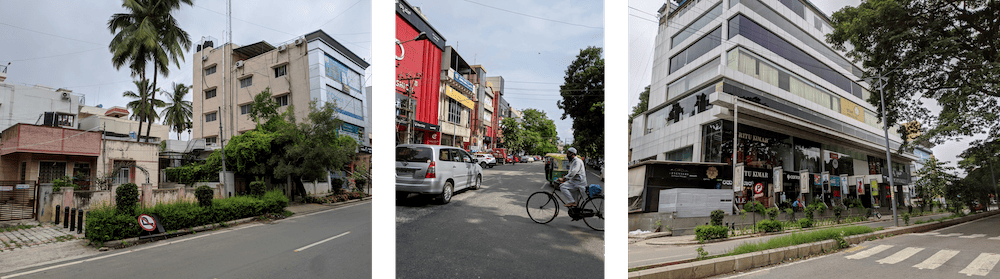
Figure 4.13 Photographs around the precinct: (Left) Redevelopment from detached housing to medium rise commercial. (Centre-Right) Amalgamation of plots to build larger commercial spaces.
Jayanagar is a well planned, affluent, residential neighbourhood currently undergoing redevelopment in response to Bengaluru’s transformation since the information technology boom. The locality has been known for its structured, interwoven road network and accommodating provisions for the residents like open spaces, footpaths, schools and essential commercial activities.
Improved transit accessibility over the last decade has propelled commercial zones, driving up land prices and reshaping the residential landscape. Despite its economic vibrancy, the unaffordable housing market has led to social segregation, hindering inclusivity. Nevertheless, Jayanagar remains an inclusive economic hub, with markets and vendors at its core even with a thriving commercial high street.
[This article has been republished with permission and with minimal edits]