“India is technically in stage 2,” clarified Lav Agarwal, Joint Secretary at the Union Health Ministry in a press briefing on March 30th. He was responding to speculation which had arisen from a MoHFW document which pegged India’s current stage as “local transmission and limited community transmission phase.”
This came after a recent interview with the director of Association of Healthcare Providers India (AHPI) by Quint, which had indicated the onset of stage 3. The speculation was cut short yet again, when AHPI released a statement on social media claiming that the Quint’s claim was misleading. The post also claimed that the increase in cases was purely arithmetic and not exponential or geometric, as is the case in Stage 3.
So are we in Stage 2 or Stage 3? Has the growth been arithmetic of exponential?
The confusion has been ever growing. However, when we looked at data of 8 weeks between January 30 and March 29, we found that contrary to the statement from AHPI, the increase in COVID-19 cases has in fact been exponential.
Is Coronavirus growing exponentially in India?
Linear Growth is marked by an increase by a fixed number at every interval. For example, 1,3,5,7,9 is a series representing linear growth. While the amount increases by a fixed number every time, the rate of growth actually decreases. In the above series, the rate of growth is 200%, 66.6%, 28.5% and so on.
Exponential growth on the other hand, is marked by an increase of an increasing number, where the rate of growth may be constant. For instance, 1, 3, 9, 27 is an example of an exponential series. Here the rate of growth is 200% at every interval.
Curves for linear growth tend to be upward rising straight lines, while curves indicating exponential growth tend to be J-shaped, almost seeming to be vertical at some point.
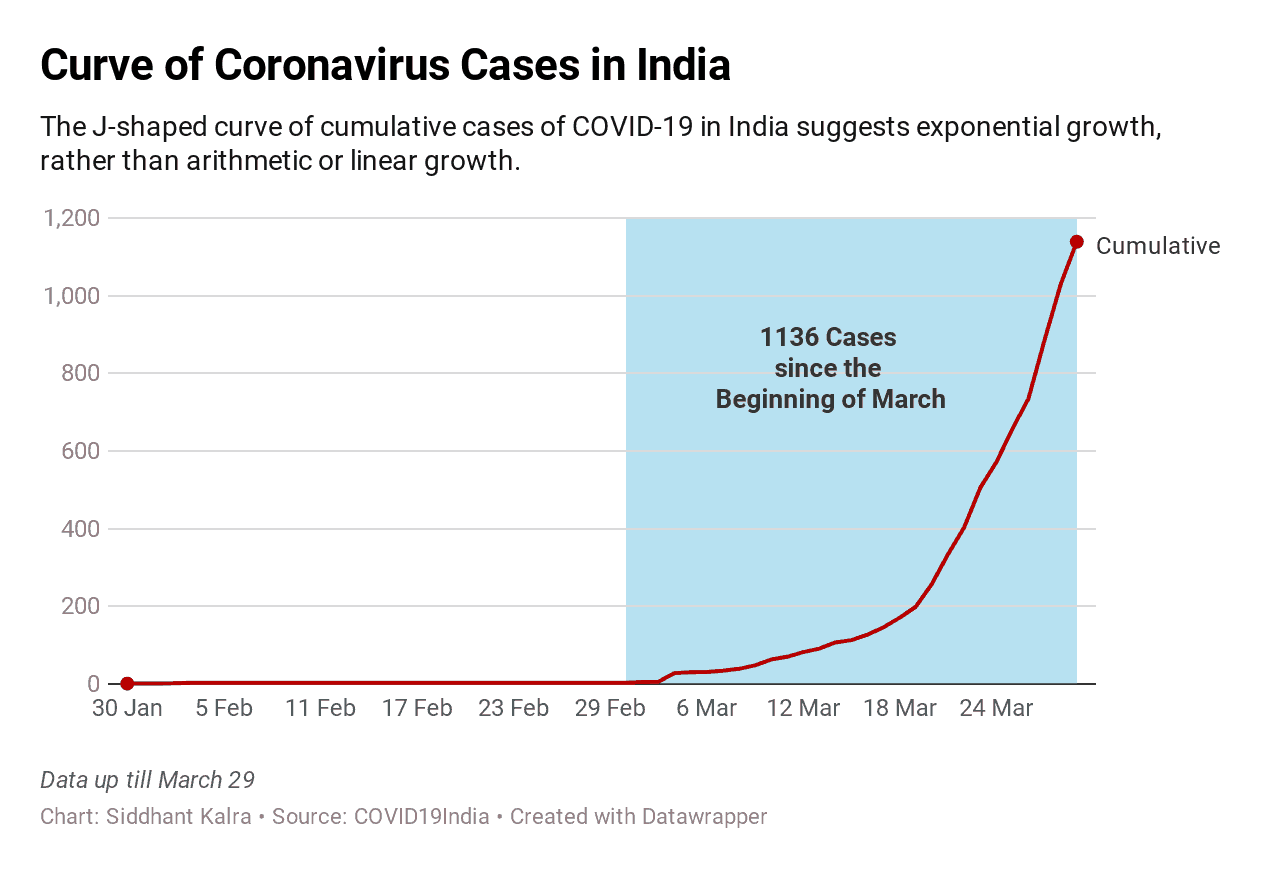
The curve of total COVID-19 cases in India does not suggest the upward sloping straight line of arithmetic or linear growth. Instead, the J-shaped curve suggests a classic case of exponential growth. It suggests that, like in most other countries, cases in India have been growing exponentially. The rate of growth since the first recorded case stands at 17%.
Considering that cases are growing exponentially, a better way to visualize the increase is to look at the doubling of cases.
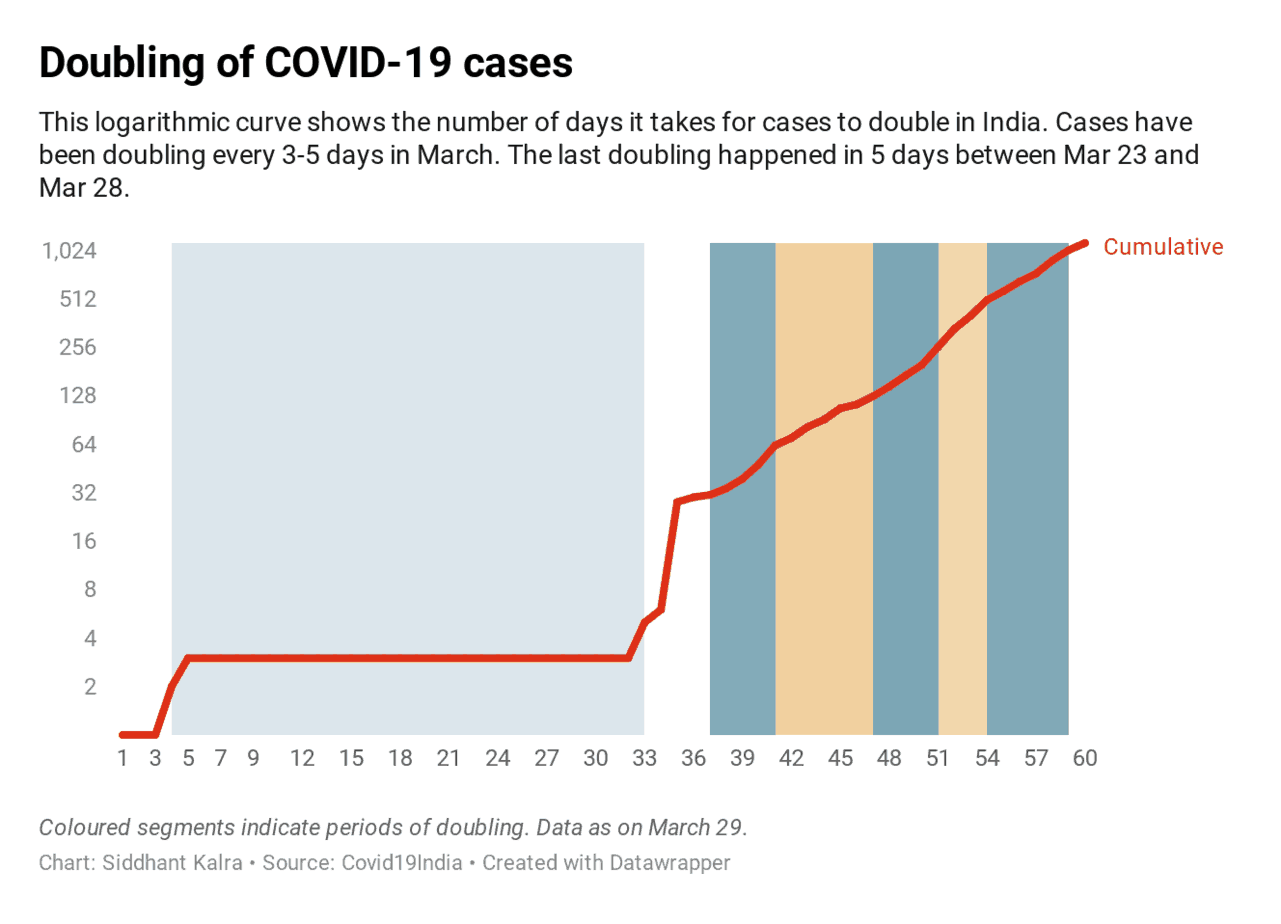
This logarithmic curve shows the time taken for the number of confirmed cases to double. Since India recorded its first case on January 30, it took a month for the number of cases to go from 2 to 4. The number of cases then rose 7 times in just 3 days between March 2 (Day 33) and March 4 (Day 35). Since then, the number of cases have been doubling every 3-5 days.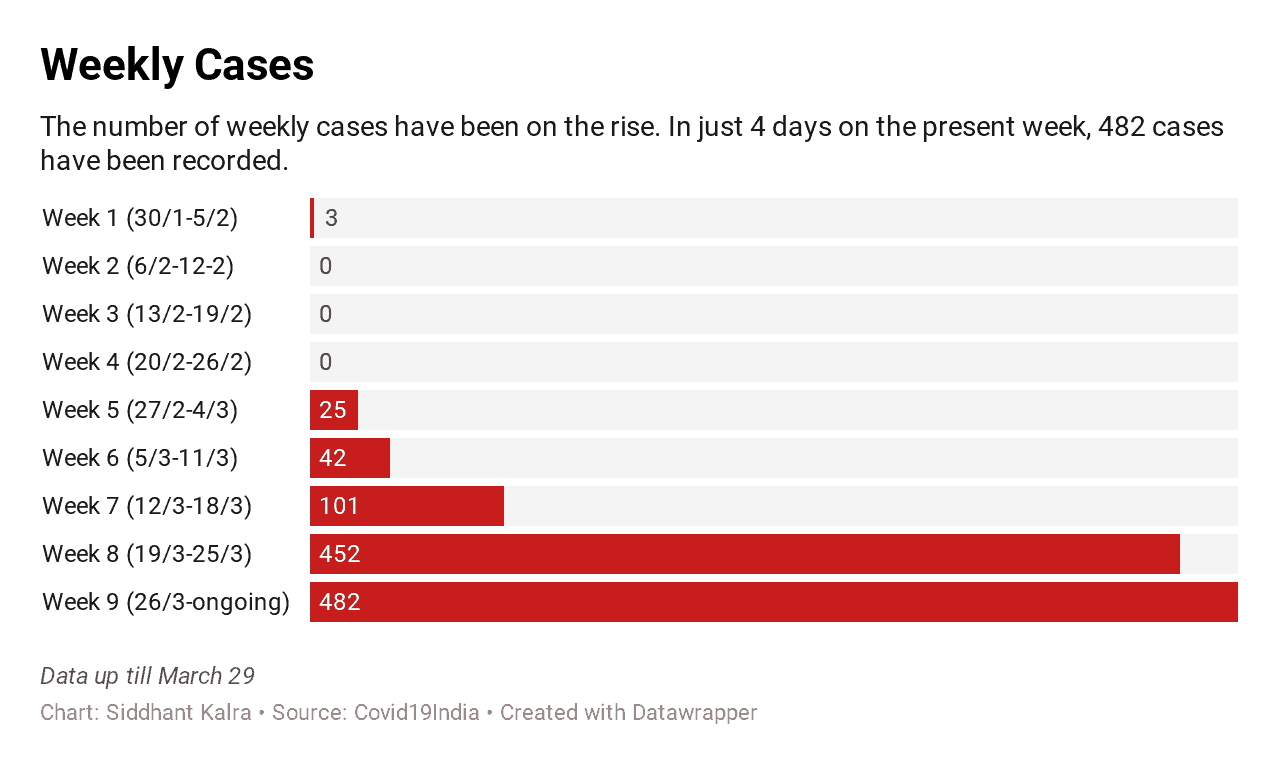
The spike in cases has happened in March, with cases rising manifold every week. 452 cases were confirmed in just the last week before the lockdown and 101 the week before that. The rate of weekly growth has been 68%, 140% and 347% in the past 3 weeks. This week (week 9), there have already been more cases in 4 days than any other week.
Flattening the curve
The ‘curve’ refers to the average trend of new cases reported in relation to the burden on the healthcare system of the region. While a vast majority of cases have reported only mild symptoms, many need medical care in hospitals.
The WHO reports that about a quarter of severe and critical cases require mechanical ventilation. If there are a large number of cases every day or every week, hospitals are driven beyond capacity and the outbreak becomes unmanageable.
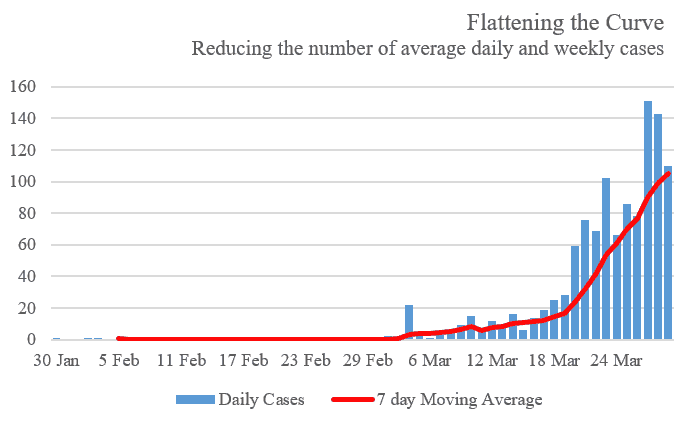 The solution is to flatten the curve of average new cases, as has been achieved in South Korea and China (according to data publicly available). Presently, India’s curve of average new cases is on an upward trajectory. While the numbers of daily cases are still relatively low, it won’t take much time for our healthcare system to be overburdened if the current trajectory continues.
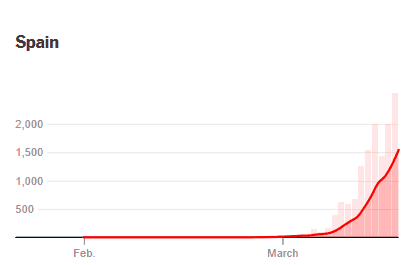
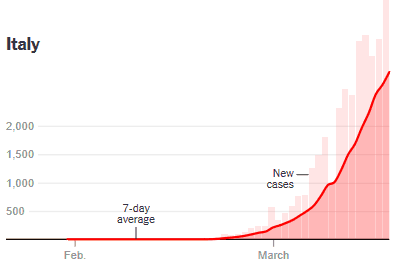
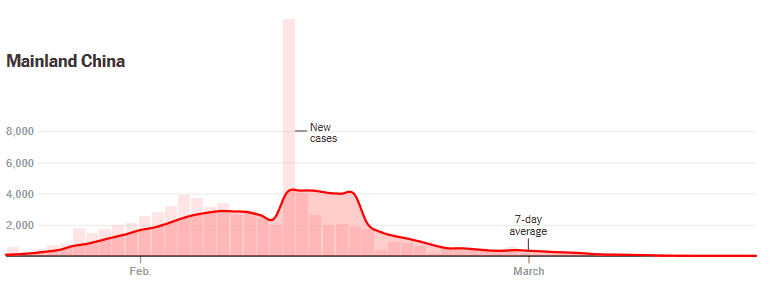
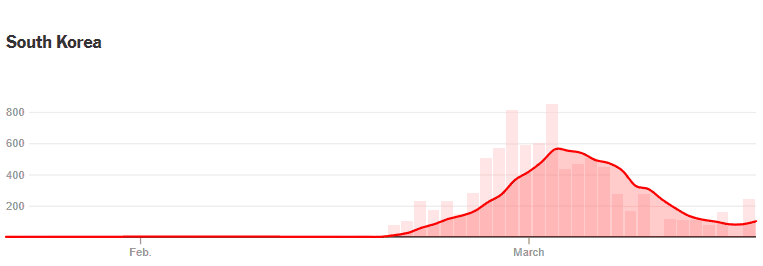
The red lines represent the 7-day average of new cases in China, South Korea, Italy and Spain Source: NYT
Only 21 tests per million population
Extensive testing allows for localization of affected areas and tracing the chain of spread, which is vital to contain the virus.
India’s testing criteria has been revised over the past couple of months. Currently, the ICMR’s testing strategy focuses on symptomatic individuals, who display a combination of COVID-19 symptoms.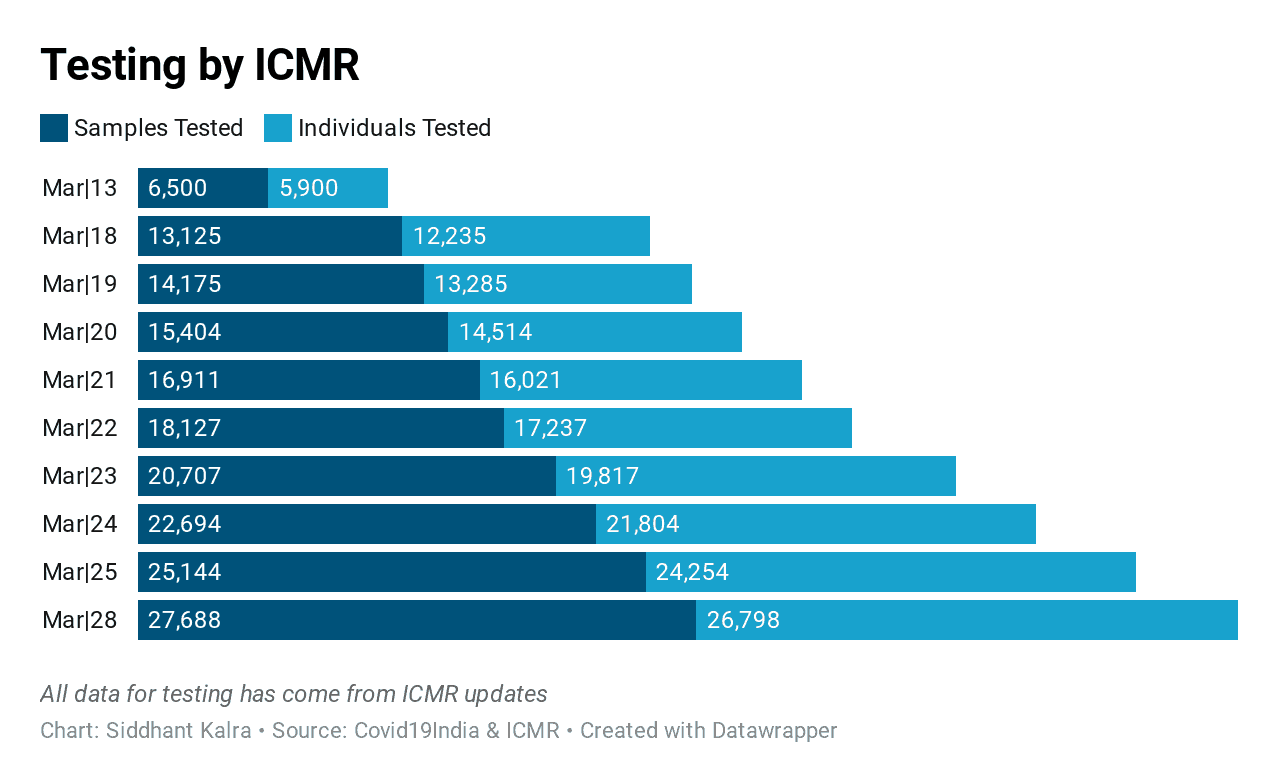
Mobilizing the government’s network of 100+ Viral Research and Diagnostic Labs (VRDL) and private healthcare facilities, the number of testing centres in India has gone up from 52 in early March to over 160.
However, India’s testing strategy has been criticized for both the exclusive focus on symptomatic individuals and the number of tests conducted. India’s tests per million rate stands at just 21 samples tested per million as on March 29th. In comparison, other countries have been testing far more vigorously. 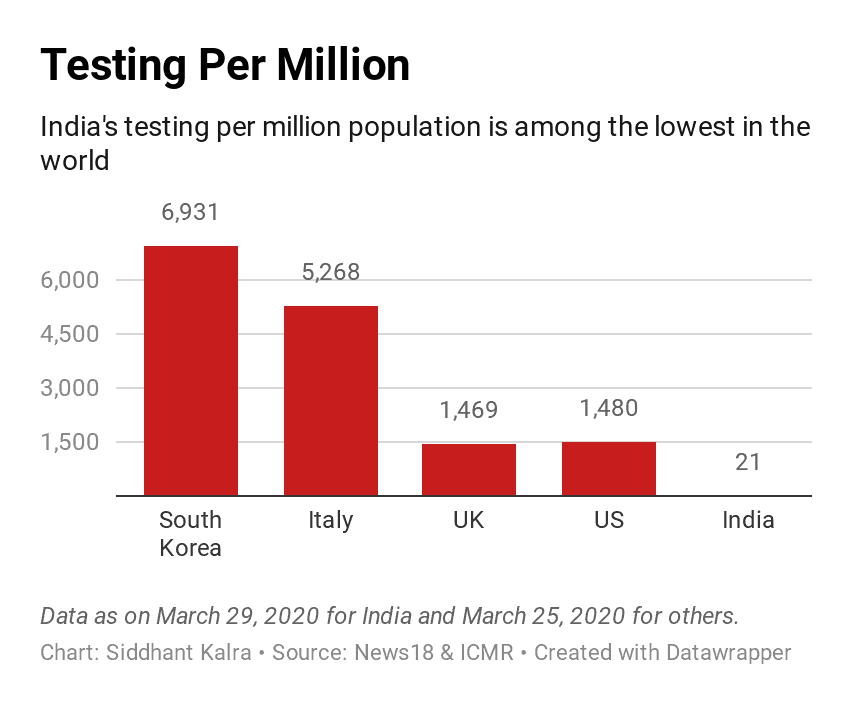 Now for some other interesting facts that emerge.
No, contrary to popular opinion, coronavirus is not just affecting older people.
In fact, the COVID19India database indicates that a majority among the coronavirus-infected in the country fall in the age group 20 – 39 years. 253 cases out of the 541 for which data is available fall in this group.
As for the older age groups, 164 cases are 50 – 79 years old. The single most affected age group is 20-29 years old, accounting for 146 cases. 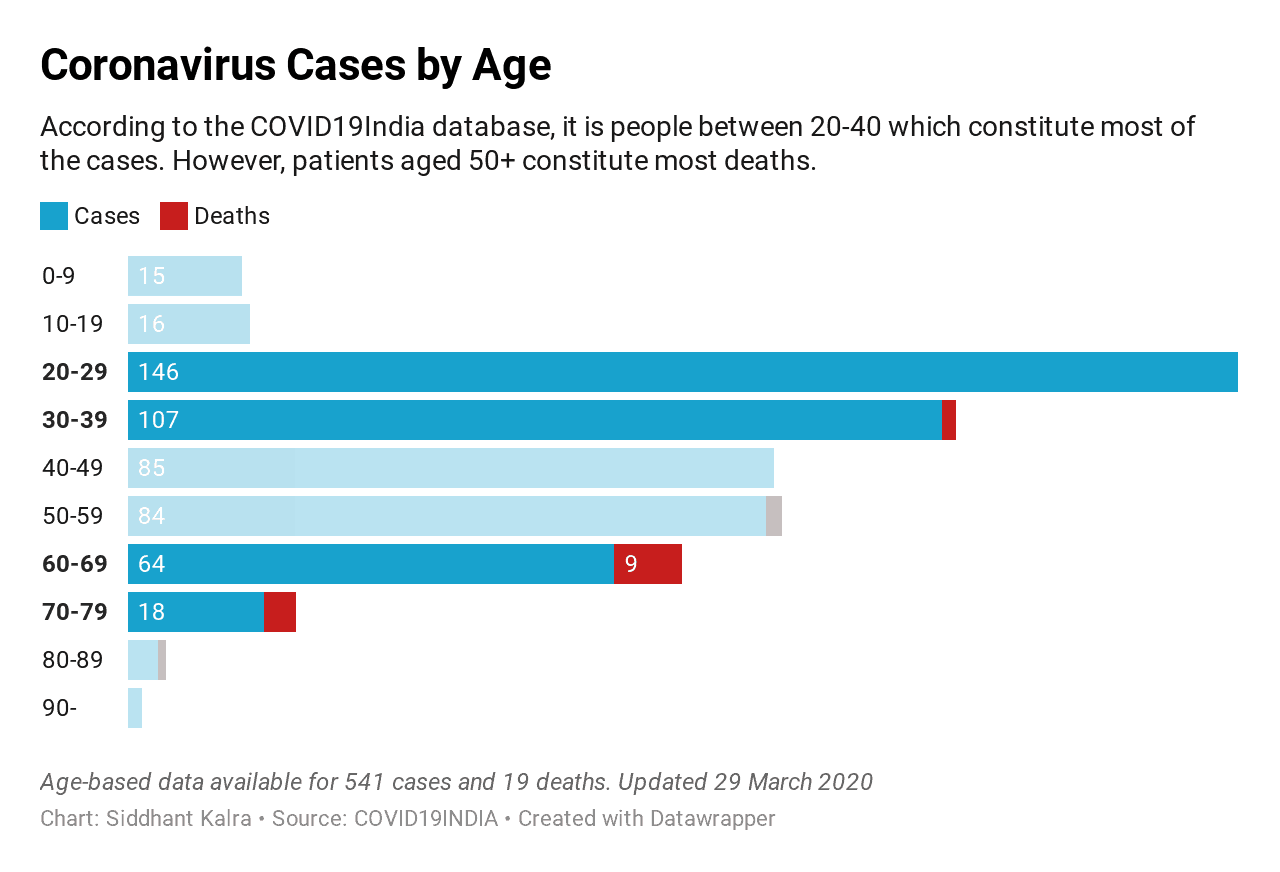 However, the notion that older people are worst-affected holds true when one looks at fatalities. Out of 19 deaths for which data is available, 9 were of people aged 60-69, and 4 of people between 70-79 years of age. People aged between 20-39 on the other hand, account for only 2 deaths, even though they constitute the highest number of positive cases.
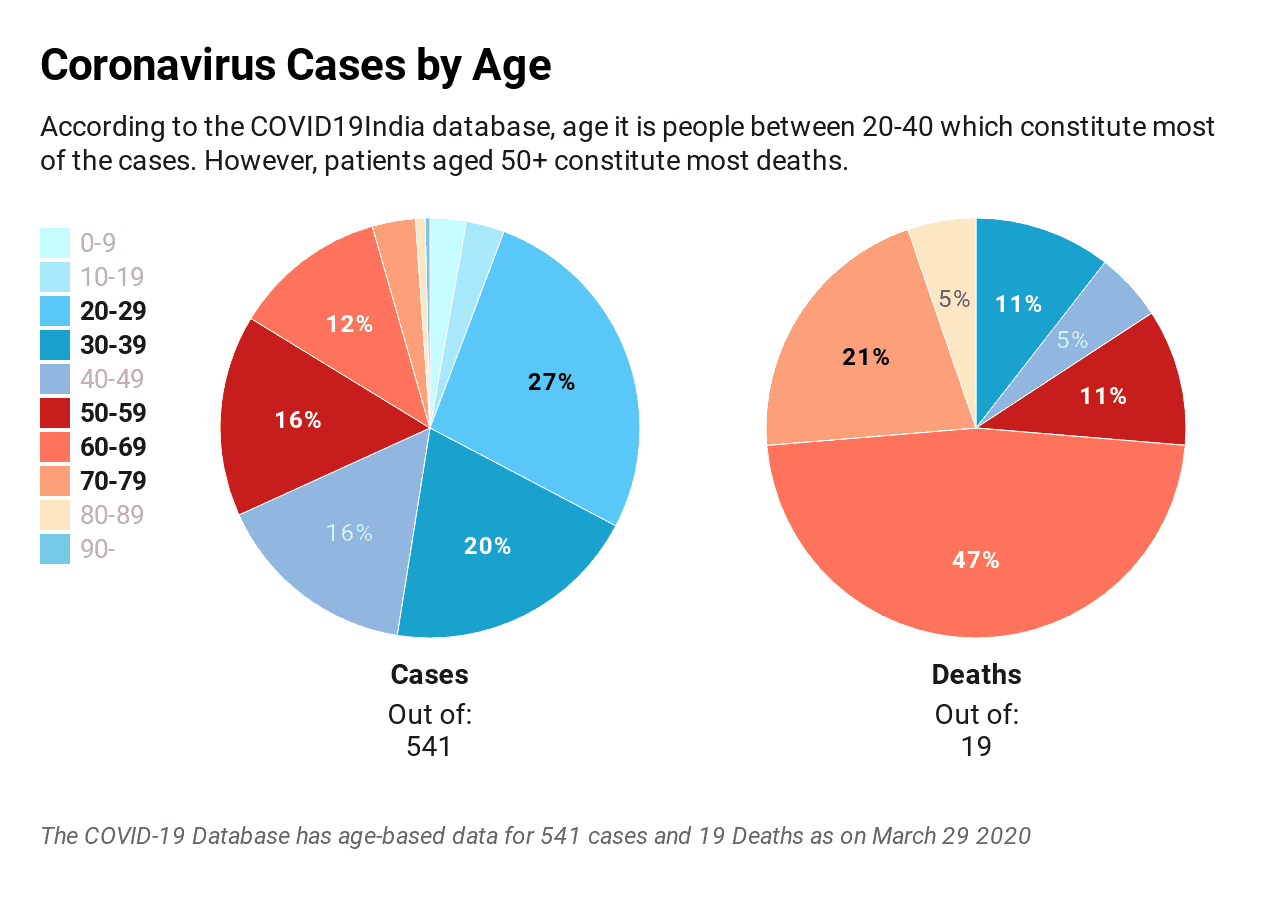
Men affected more than women
Out of 546 cases, 396 are male and 190 are female. Out of 19 people who died, only 5 were female. The same trend has been observed in other countries.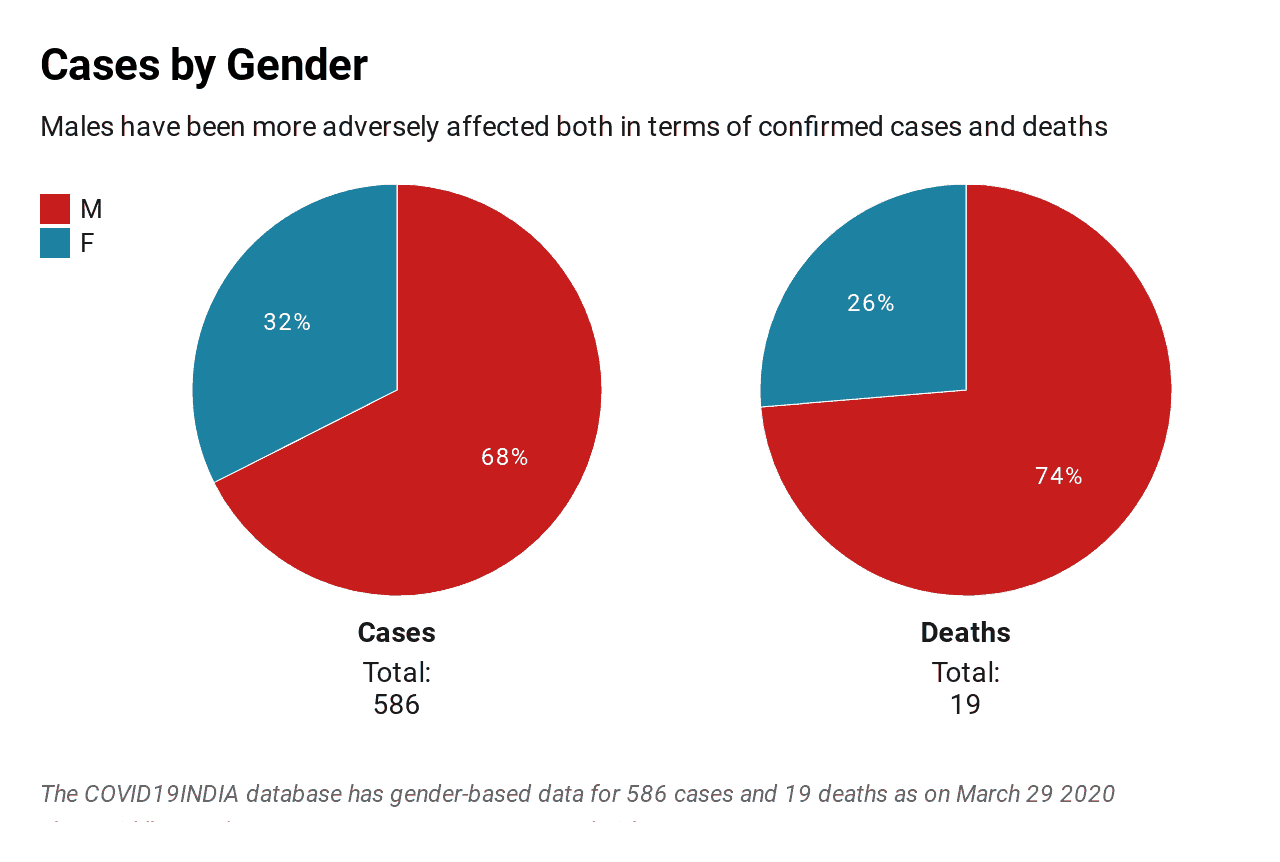 In China, one report found a higher fatality rate in men (2.8%) than in women (1.7%). 64% of those who died from coronavirus in China were men. In South Korea, 54% of the deceased were men even though more women were affected.
In Italy, men accounted for 70-71% of coronavirus deaths, while data from Spain suggests that the virus has killed twice as many men than women. According to the Guardian, the same pattern is mirrored in France, Germany, Iran and Italy. Available data from COVID19India suggests that India too is reflecting the same pattern.
Note: All data used in this story covers 60 days from the first case on January 30 till March 29. The source of data is the live patient database compiled by Covid19India.org.
The interpretation in terms of ‘exponentiality’ is fallacious. The no. of tests has also grown exponentially!
What really matters is the no of persons actually needed hospitalisation at different dates.