Garudachar Palya is part of Mahadevapura constituency, with an area of 6.5 sq km, which includes four revenue villages — Garudachar Palya, Hoodi, Seegehalli, and Nallurahalli. These villages have stayed mostly the same, while the city has expanded around them with more organised development from the BDA. This mismatch has led to issues like narrow village lanes becoming crowded with traffic, as they’re now used as shortcuts to bypass main roads.
Looking at population growth, between 2011 and 2024, the ward has seen an estimated increase of 62.24%. This rapid growth adds to the existing strain on infrastructure.

At a datajam co-hosted on August 4th this year by OpenCity, an Oorvani initiative, in partnership with WRI India and the BBMP Climate Action Cell, supported by ATREE, we looked at the impact of Urban Heat Islands (UHI) on pedestrians in the ward. We used the BBMP land use map (Revised Master Plan 2017), the ESA land cover map 2021 and Landsat data (from Google Earth Engine) to understand what percentage of land was built up and density of built spaces and vegetation. We marked the position of several landmarks to see how they influenced the UHI effect.
In terms of land use, we found that most of the area is residential, with smaller sections designated for commercial and industrial use. Some of the landmarks we identified include Phoenix Market City, Prestige Shantiniketan, and Satya Sai Hospital.

Read more: From industrial boom to heat doom: Peenya’s struggle with rising urban temperature
Key findings
One of our key observations is that almost 80% of the ward is built up, with very limited tree cover—about 1.115 square kilometres. This lack of green spaces is concerning because it contributes to higher land surface temperatures. From 2017 to 2021, we observed that the temperatures in the ward ranged from 27.5°C to 37°C, with the highest temperatures concentrated along the road network.
When we calculated the vegetation index, it was clear that green spaces are far below recommended guidelines. The ward also has no BBMP parks, which was quite surprising to us. Lack of such green spaces deprives people of a place to pause or rest during their commute. (Note: These do not include walking paths and waterfront infrastructure created by the BBMP around lakes.)

Next, we looked at the walkability of the ward and its public transport connectivity. The situation isn’t ideal—many residents have to walk between 1.5 and 2 kilometres to reach a bus stop, while the recommended walking distance is just 1 kilometre. This lack of public transport access pushes people to rely on their own vehicles, worsening traffic congestion and contributing to the urban heat island effect.

In the shoes of a pedestrian
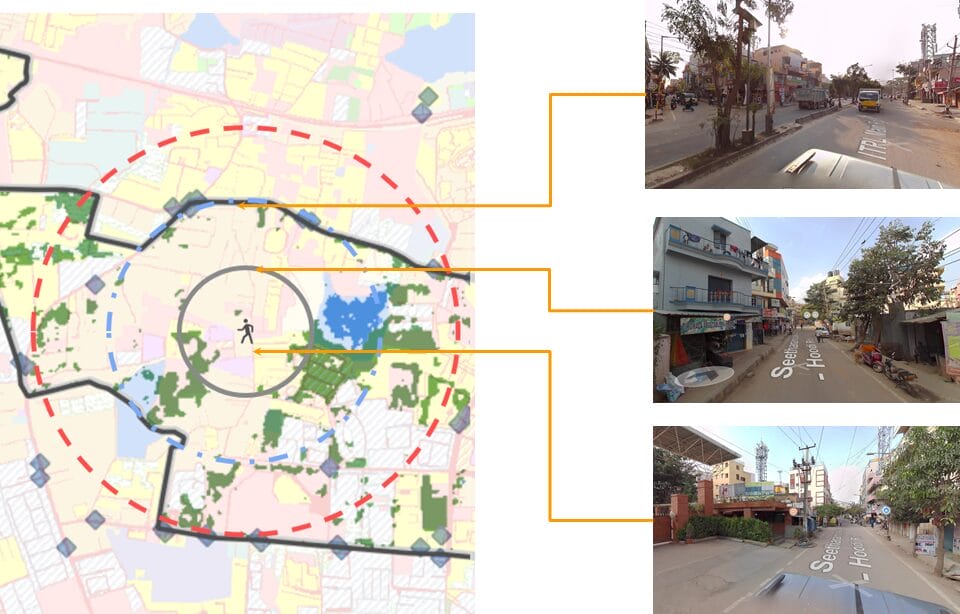
We conducted a sample study of Seetharampalya Main Road to assess walkability. Using Google Street View, we confirmed that our observations aligned with the findings from map studies — excessive concretisation and the absence of green infrastructure have significantly affected the ease of walking along this key arterial route.
In this study, we focused on the path from the gate of Gopalan Institutions to Hoodi Circle, the closest bus stop, located 1.5 km away. Street view images were taken for walkability distances of 0.5 km, 1.0 km, and 1.5 km. These images revealed that, although tall buildings are present nearby, walkability is still compromised due to the lack of green cover for shade and insufficient buffers separating pedestrians from traffic. This would also contribute to higher land surface temperatures (LST).

Solutions
There is a real need for solutions to make Garudachar Palya a more connected and sustainable ward.
From our review of maps and satellite imagery, it became clear that access and walkability are significantly hindered by the lack of infrastructure to facilitate pedestrian movement.
- Increasing green cover could improve both the walkability of the area, while also addressing last-mile connectivity challenges. There’s a lot of potential to enhance green cover along roads and around bus stops to encourage better pedestrian experiences.
- Additionally, there are no parks in the ward. BBMP should actively work on creating green, open public spaces here.
- A more comprehensive approach is also needed to improve public transport in the denser areas. This would enhance mobility and reduce traffic congestion, which in turn could help lower the area’s land surface temperature (LST).
- Lastly, strategies to create localised heat sinks should be implemented to make public spaces more comfortable for people to use.
Lastly, we also believe that the community has a vital role to play in solving these issues. By getting involved, they can push for better transport access and infrastructure improvements, similar to successful initiatives in other areas like HSR Layout.