Ever since lockdown norms were eased, Chennai’s COVID tally has seen significant variations. Over the past few weeks, however, Chennai has been witnessing less than 1,000 cases in a consistent manner.
What can we infer from the numbers?
Is Chennai on course to see a continuous fall in the numbers?
Here are some of the key takeaways based on an analysis of data from August to October:
Fluctuating number of positive cases per day
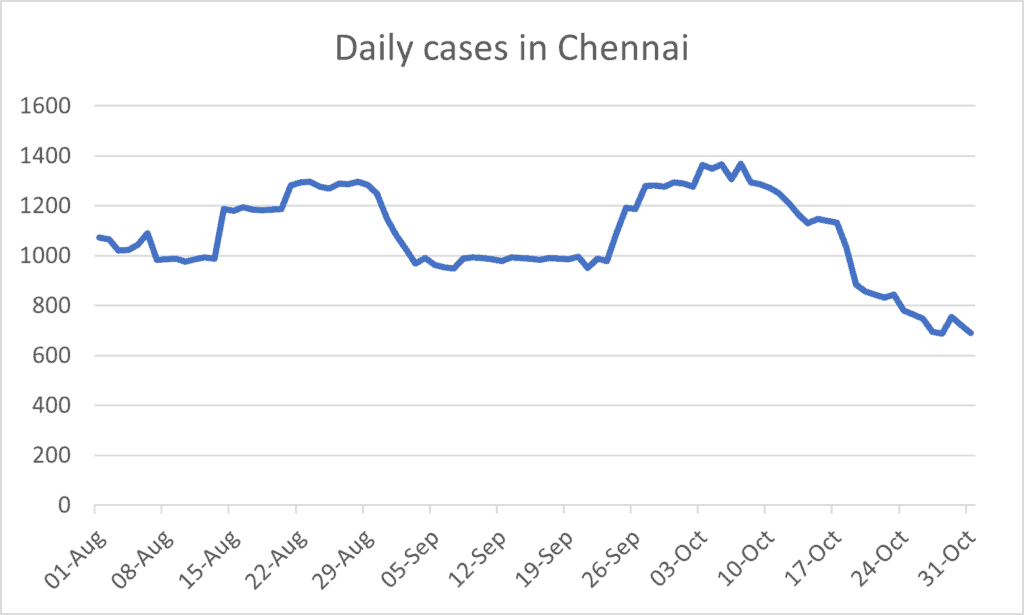
There has been a rise and fall pattern observed in the number of cases in Chennai over the last three months; if we take 1000 as a cut-off number, cases have gone above and below as follows.
| Number of daily cases | Time period |
|---|---|
| Below 1,000 | August 7th to 13th September 3rd to 23rd October 19th to 31st* |
| Between 1,000 and 1,200 | August 1st to 6th August 14th and 20th August 31st to September 2nd September 24th to 26th October 13th to 18th |
| Above 1,200 | August 21st to 30th September 27th to October 12th |
Since October 19th, Chennai has been witnessing cases ranging between the 600s and 800s. On October 28th, Chennai witnessed the lowest 24-hour case load in the last three months: 688.
So, can we assume that Chennai has succeeded in flattening the curve already? That may be premature, though.
“At the beginning of August, there was a slight dip in the number of cases and it looked like we had flattened the curve. Shortly afterward, the curve peaked and the pattern repeated itself. The virus is highly unpredictable given the relaxations and people’s behaviour which cannot be monitored,” says Dr Padma Srikanth, Professor of Microbiology, Sri Ramachandra Institute of Higher Education and Research (SRIHER).
Variations in sample count
The fluctuation in daily incidence is often dependent on the number of persons being tested, which has also varied quite a bit:
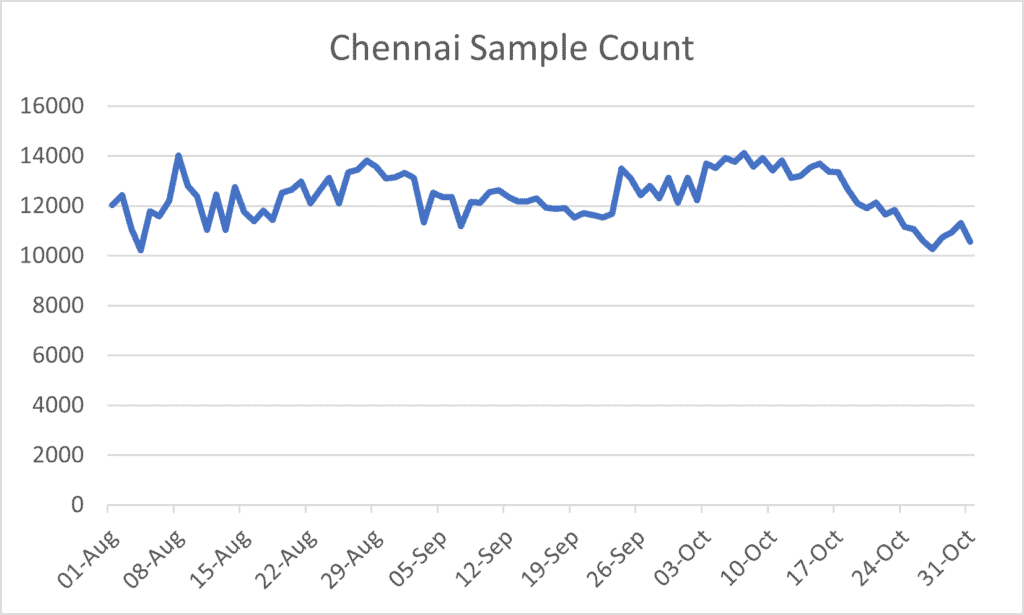
- The city had been testing 12,000-odd people every day, but the number fell sharply to 10,227 on August 4th.
- Following the dip, the testing numbers again rose to 12000 and ranged between 12,000 and 14,000 till October 25th. Post which, the number of persons being tested marginally dipped and ranged between 10,000 and 11,000.
- In the last three months, Chennai recorded the highest testing count on October 7th; the city had tested 14,125 persons. It may be noted that this is also the same date on which it recorded its three-month highest daily case load with 1,369 fresh cases.
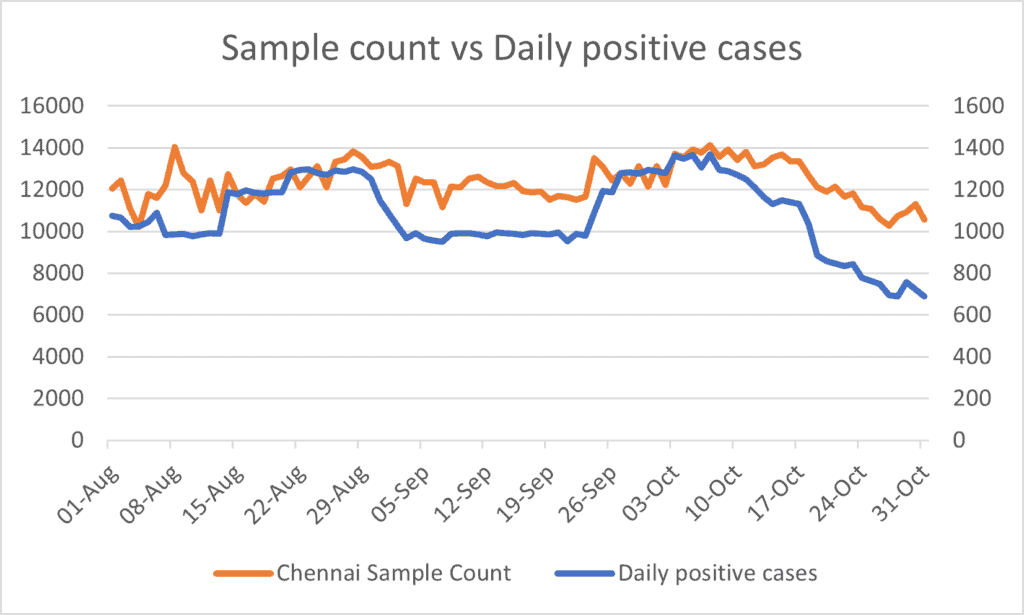
An analysis of the number of positive cases per day and the sample count shows that the number of cases has had a largely positive correlation with the number of tests done — that is, greater the number of tests done by Greater Chennai Corporation (GCC) tests, the more the number of cases reported. Hence, it is suggested that the civic body should increase the sample count to identify and isolate more positive cases.
Fatality rate
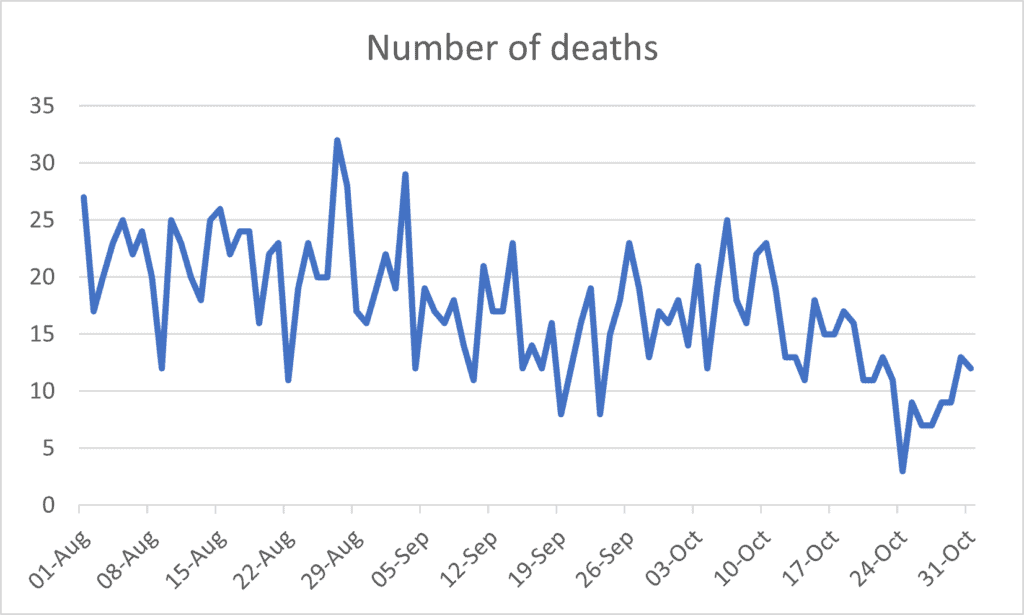
On August 27th, the fatality rate in the city rose to 32. In general, however, the number of deaths during these three months has been lower than what was recorded in previous months.
Dr Padma says the primary reason for the lower fatality rate is due to improved infrastructure and increased early detection of cases. The number of institutions treating coronavirus disease has also substantially increased over the period. As on November 3rd, 12 government hospitals and 104 private hospitals in Chennai offer COVID treatment. The effort is also supplemented by GCC’s fever camps.
Number of discharged patients
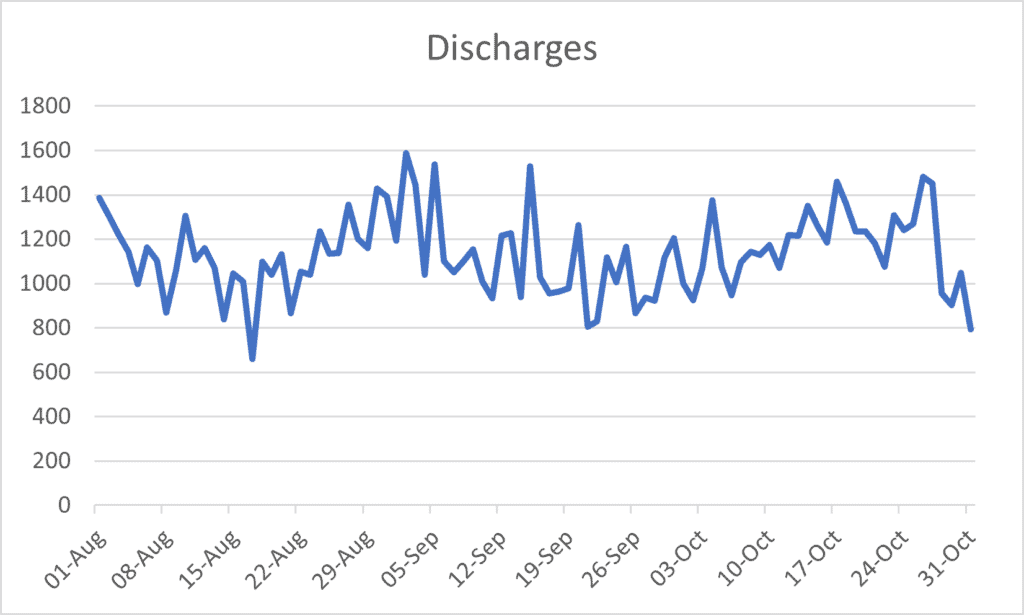
The discharge rate is considerably high in Chennai. On average, about 1,000-1,200 patients are discharged per day. In the last three months, September 2nd saw the highest number of discharges — 1587.
“Although the number of patients discharged has risen, the nature of the virus is dynamic. Many patients are developing complications after they test negative and are discharged. Patients should keep a close watch on their health after recovery,” adds Dr Padma.
Zone-wise cases
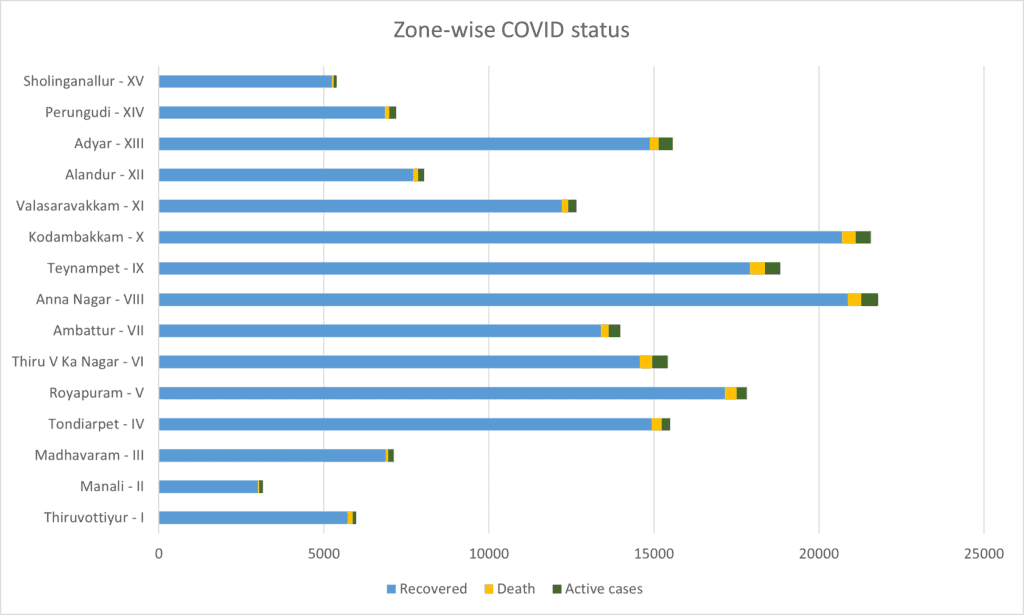
The civic body bulletin suggests that Anna Nagar (Zone 8) recorded the highest number of recoveries (20,877), followed by Kodambakkam (Zone 10) and Royapuram (Zone 5) with 20,777 and 17,751 recoveries, respectively, between August 1st to October 31st.
Teynampet (Zone 9), Anna Nagar and Kodambakkam recorded 456, 412 and 405 fatalities, respectively.
(Data provided by Sridhar Venkataraman, an active resident of Mylapore.)