In the OpenCity Bengaluru Design Jam on BBMP, our team analysed and debated the bylaws and zoning rules governing civic amenities, parks and open spaces in the city. As a diverse group of spatial thinkers and design creatives, we sought to understand what liveability meant for citizens navigating the urban landscape, and how building and zoning laws address our needs and the city’s densifying future.
Urbanisation is transforming cities worldwide, significantly impacting the quality of life both socio-economically and environmentally. In democratic societies, livability crises affect and are affected by the different levels of urban growth and how cities are managed. This study, for example, looks at what makes cities liveable by measuring neighbourhood satisfaction and happiness, using data from two cities to explore the key factors behind these feelings.
According to Paul (2024), while environmental protection indicators are gaining prominence globally, the correlation with the right to basic amenities and facilities for urban livability is under-recognised.
The growing number of indicators in the Ease of Living Index by the Ministry of Housing and Urban Affairs (MOHUA), India (Smart Cities Council, 2020), showcases the importance of these public amenities for citizen access. However, the question remains: are these indicators reflected on the ground in our cities?
Read more: Karnataka government’s not-so-green plan for parks
Civic amenities in Bengaluru
Bruhat Bengaluru Mahanagara Palike (BBMP) and the Bangalore Development Authority (BDA) define “Civic Amenities” (CA) as essential facilities for the welfare and functionality of communities in residential layouts. They include water supply installations, electrical installations, waste management facilities, public safety and educational facilities, and transport facilities, as outlined in the BDA Act of 1976.
Additionally, CA sites owned by the BDA, can be repurposed according to local needs and the now-scrapped Revised Master Plan 2031. Designated open spaces must be transferred from private developers to municipal authorities like the BBMP for maintenance.
Importance of parks and open spaces
Parks and open spaces, including lakes, streams and their buffers, are also classified as civic amenities. These green spaces play a very important role in enhancing urban livability and environmental health. Leveraging the legal status of green-blue spaces as civic amenities is crucial for protecting such spaces that exist. It can also ensure their integration into urban planning, especially of urban peripheries and new layouts.
Global standards for open spaces
Global standards vary, with the World Health Organization (WHO) recommending 9 square metres of open space per person in urban areas. The United Nations (UN) suggests 30 square metres. And the European Union (EU) advocates for 26 square metres. Aligning with these standards, the URDPFI Guidelines in India recommend 10-12 square metres of open space per person.
BBMP Building bye-Laws stipulate that 10% of the land in residential development plans should be reserved for parks and open spaces, with a minimum of 5% for other civic amenities such as community centres, public utilities etc. These amenities must be developed by the owner or developer, and handed over to the residents’ association for maintenance. Mapping these areas ensures they remain intact and free from encroachment.
Read more: Concretising open parks — this is not the development people want or need
Identifying wards of study
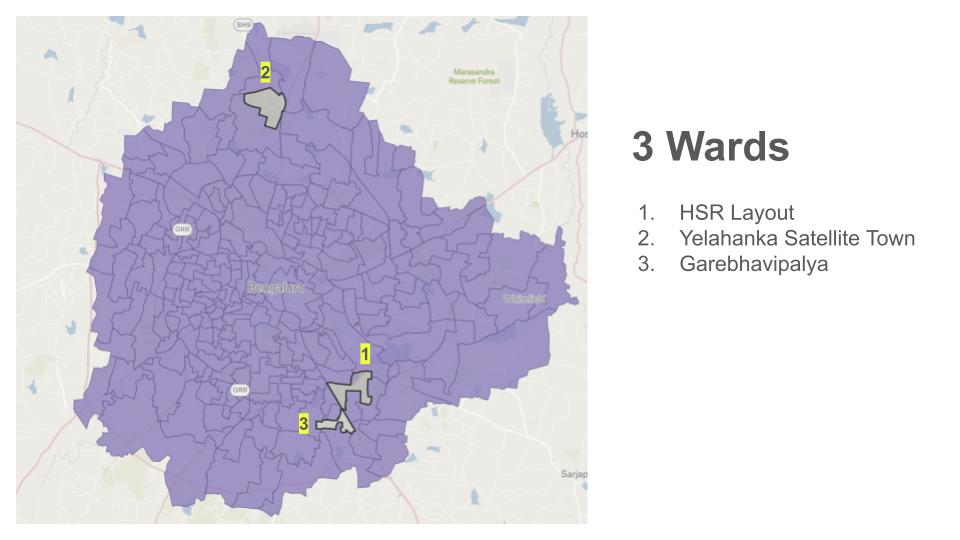
At the design jam, therefore, we decided to map these park areas in select wards to verify the available areas of parks and green spaces (to ascertain if they meet population standards) and their walkability access. The team used felt.com to visualise open-source data at the ward level to demarcate parks and open spaces in three select wards across the Bengaluru Urban District. Open-source data fosters transparency, enabling citizens to access, analyse, and contribute to information that shapes their environment.

Current data on the accessibility of civic amenities in Bengaluru highlights significant disparities:
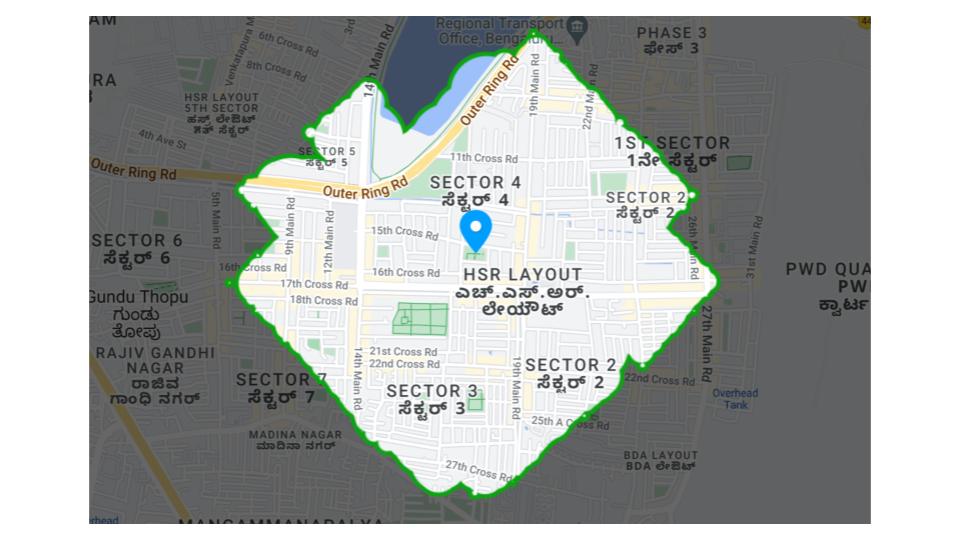
- HSR Layout: covering 3.81 square kilometres, has 19 parks totalling 12.54 hectares, more than the expected 6 hectares for its population of approximately 37,000, as per the 2011 Census.
- Yelahanka Satellite Town: spanning 4.69 square kilometres, features 20 parks totalling 11.57 hectares, also exceeding the expected 6.8 hectares for its population of around 42,500.
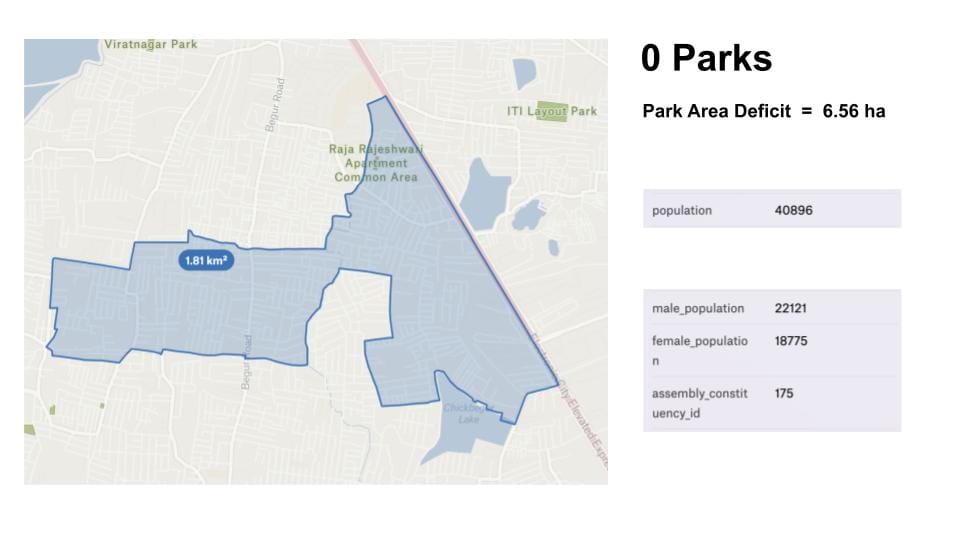
- In stark contrast, Garvebhavipalya, which covers 1.81 square kilometres and has a population of approximately 41,000, has no parks at all, with an expected park area of 6.56 hectares.
This highlights a significant gap in civic amenities.


Given the availability of excess open spaces, we also looked at their walkability in the ward using www.walkscore.com. It was evident that the distribution of green spaces was skewed toward certain strata of society. Housing pockets with higher built-up density, often corresponding to lower-income areas, have a severe dearth of green spaces and other civic amenities.
For example, Mangammanapalya, a high-density, mixed-use residential area (population density: 18,956 persons per sq. km) features fine grain building footprints suggesting a lower-income region. The irregularly arranged buildings create a dense urban fabric with little room for open spaces, the only one being a private school playground that is inaccessible to the public (Khatavkar, 2018). This highlights the fact that while some wards as a whole may have parks and open spaces in abundance, their accessibility is not equitable.

The presence of open spaces proves to be critical infrastructure during climate extremities. Scientific research has shown that trees and open spaces can mitigate the urban heat island effect during summers and urban flooding during monsoons, and overall, can serve as a community hub for social cohesion. The inequitable placement of such civic amenities makes certain sections of society more vulnerable to climate impacts as well.
This openly available data reveals how urban planning largely serves the privileged. Inclusive urban planning requires collaboration between residents and planners to identify gaps and optimise zoning and bye-laws for the collective good.
Addressing gaps in civic amenities for enhanced livability
Identifying and addressing gaps within these bye-laws can enhance liveability through improved access to essential civic amenities through ground-truthing.
Ground-truthing involves verifying data obtained from remote sensing, aerial imagery, or other sources by comparing it with direct, on-site observations. This process ensures the accuracy and reliability of remotely collected data, making it crucial for effective implementation.
The next level of analysis involves understanding how many of these civic amenities (particularly open, blue-green spaces) actually exist on the ground, how much of the legally allowed civic amenities are being encroached upon for other activities, and measuring the actual walkability and pedestrian path quality in these wards.

Comparing Bengaluru with cities like Jakarta, which exhibit superior access to civic amenities, can provide insights for targeted improvements in urban planning. A people-centric approach, recognising the climate co-benefits of green spaces, and co-locating these spaces with other urban commons can build community resilience and stewardship. By integrating these strategies, Bengaluru can enhance the availability and accessibility of civic amenities, support sustainable urban development and improve community wellbeing.
Nice article. At the end of the day all cities should be more environment friendly and livable for the common man.