This article is part of a special series: Air Quality in our Cities |
Chennai residents woke up to choking weather on Bhogi morning, as thick smog covered the skyline post the regular ritual of burning garbage, old furniture and tyres in the city. The air quality indicators, within permissible levels till 4 am in the morning, shot up to hazardous levels and remained severe till at least 9 am on Monday, January 14th.
Already reeling under unabated industrial pollution, Ennore was among the worst hit areas during the Bhogi festival, as PM 2.5 levels here soared up to 640 µg/m3 between 4 am and 8 am on Monday, according to data provided by Urban Sciences, developer of Atmos Air quality devices.
The following table shows the air quality in other localities of Chennai:
| Location | PM 2.5 levels* (µg/m3) | Status |
| Eldams Road | 349 | severe |
| Kodungaiyur | 241 | very poor |
| Ennore | 444 | severe |
* PM 2.5 levels mentioned in the table are an average of the levels gathered from the real time data between 12 am and 8 am on Monday.
The safe standard for PM 2.5 (24-hour average), according to Central Pollution control Board (CPCB) is 60 µg/m3, although World Health Organisation caps it at 25 µg/m3.
One can imagine the impact that the skyrocketing PM 2.5 levels created on the health and well being of residents on that morning.
Relative levels
A press release from the Tamil Nadu Pollution Control Board (TNPCB) says that PM 10 levels in the city on Bhogi were 40 percent less than last year. “There was no disruption in flight services on Bhogi day,” the Board shared in its release. However, reports say that as many as 30 flights were delayed in Chennai due to smog and low visibility.
PM 10 levels were above the statutory limit of 100 µg/m3 in all the fifteen stations this year. But the 24-hour average of PM 10 levels at Valasaravakkam station peaked to 386 µg/m3 last year, while peak levels fell to 185 µg/m3 this year. The highest PM 10 levels of 240 µg/m3 were recorded at Tondiarpet this year, due to metro rail construction, stated the release.
However, with no reference levels for last year, PM 2.5 levels could not be compared. However, the 24-hour-averages were within the permissible limit in eight of the 15 air monitoring stations, as shared by the TNPCB:
Is Chennai air safe, then?
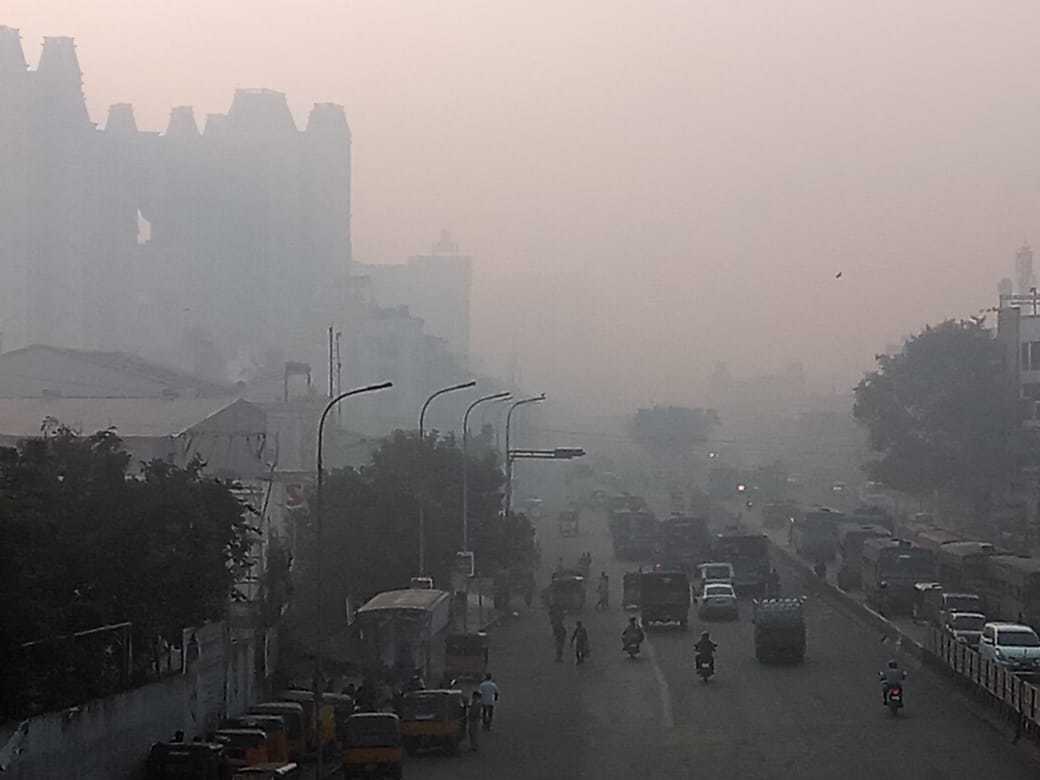
A blanket of smoke covers the roads of Koyambedu on the Bhogi day. Pic: Laasya Shekhar
The general belief among Chennaites is that air quality in the coastal city is good and there is only temporary deterioration during festivals such as Diwali and Bhogi. However, historical data says otherwise.
Tamil Nadu Pollution Control Board (TNPCB) that monitors pollution in the city does not upload real time air quality data on its website. Awareness sessions by the Board before Diwali and Bhogi generally commence barely a week before the festivals and hence, their impact is limited. “It is only this year that TNPCB officials have pulled up their socks and are trying to educate the people. They conducted discussions and released health bulletins about the adverse health effects of burning garbage,” said Somna K, a resident.
Air quality data from Tamil Nadu Pollution Control Board (TNPCB) in five stations of Chennai — Kilpauk, Adyar, Anna Nagar, Nungambakkam and T Nagar — between the months of January and November 2018 (data after November is unavailable on the website) paints a rosy picture. The levels, noted barely for nine days each month, portray the air quality as either moderate or satisfactory. However, the 24-hour averages taken twice a week in Anna Nagar and T Nagar on 2nd and 3rd January, showed PM 2.5 and PM 10 levels exceeding the permissible limit.
Data analysed by Urban Sciences indicates a gradual increase in PM 2.5 levels in Chennai. Urban Sciences monitors air quality at five arterial places in the city: Eldams Road, Ennore, Kodungaiyur, Kurivimedu and Nandanam.
| Location | Highest PM 2.5 levels (µg/m3)* | Second highest PM2.5 levels (µg/m3) |
| Ennore | 149 (Nov 6) | 95 (Nov 12 & Nov 13) |
| Kodungaiyur | 76 (Nov 12) | 75 (Nov 13) |
| Kuruvimedu | 81(Nov 10) | 80 (Nov 11) |
| Eldams Road | 84 (Nov 6) | 79 (Nov 12) |
| Nandanam | 51 (November 12) | 50 (November 13) |
*Levels of PM 2.5 from November 1 to November 20 in the above mentioned five locations were analysed to come up with the highest levels.
Lapses in TNPCB monitoring
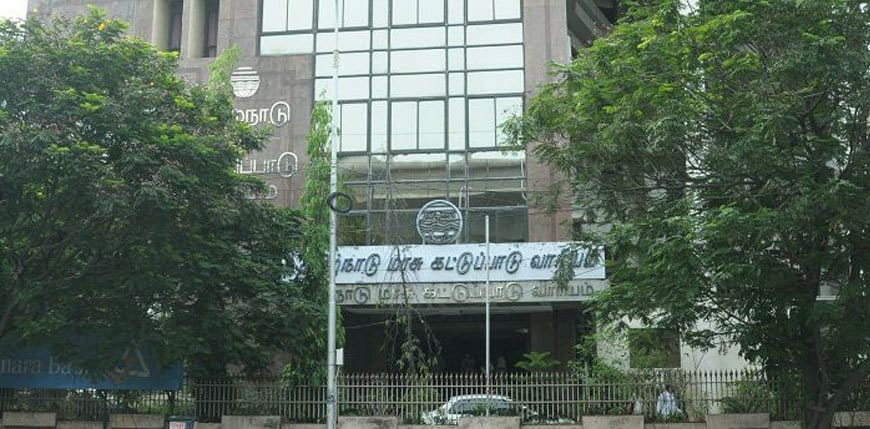
Tamil Nadu Pollution Control Board
There are many loopholes in the way TNPCB monitors air quality in Chennai, as evident from questions raised by environmentalists and the general public. Some of the most critical ones that need to be addressed are as follows.
- TNPCB uploads the monthly average data for five localities (Kilpauk, Adyar, Anna Nagar, Nungambakkam and T Nagar) in the website. But no one is aware of where these air monitors are placed. Why is that information not made public?
- Why is air quality data not kept up to date? Data for the months of December 2018 and January 2019 are still not uploaded on the website.
- Real time monitoring by TNPCB is confined to the industrial areas. The data shows a sustained rise in pollution levels from the industrial units of Thiruvallur. Is TNPCB taking any action to curb the violation?
- Why are residential areas not taken into account in real time monitoring?
- Real time data for the city is not uploaded on the website, even on important occasions such as Bhogi and Diwali. Why?
“24-hour averages, taken from hour-to-hour calculations, can only indicate the gravity of the situation. TNPCB’s data cannot be counted as accurate, as the samples are collected only on a few days of a month,” said Shweta Narayan, co-ordinator of the Health Energy Initiative – India.
Citizen Matters Chennai’s efforts to contact the spokesperson and the deputy director of the TNPCB were futile.
| This article is part of a special series: Air Quality in our Cities, and explores the root causes for air pollution and solutions for improving air quality in Bengaluru and Chennai. This series has supported with a grant from Climate Trends. |