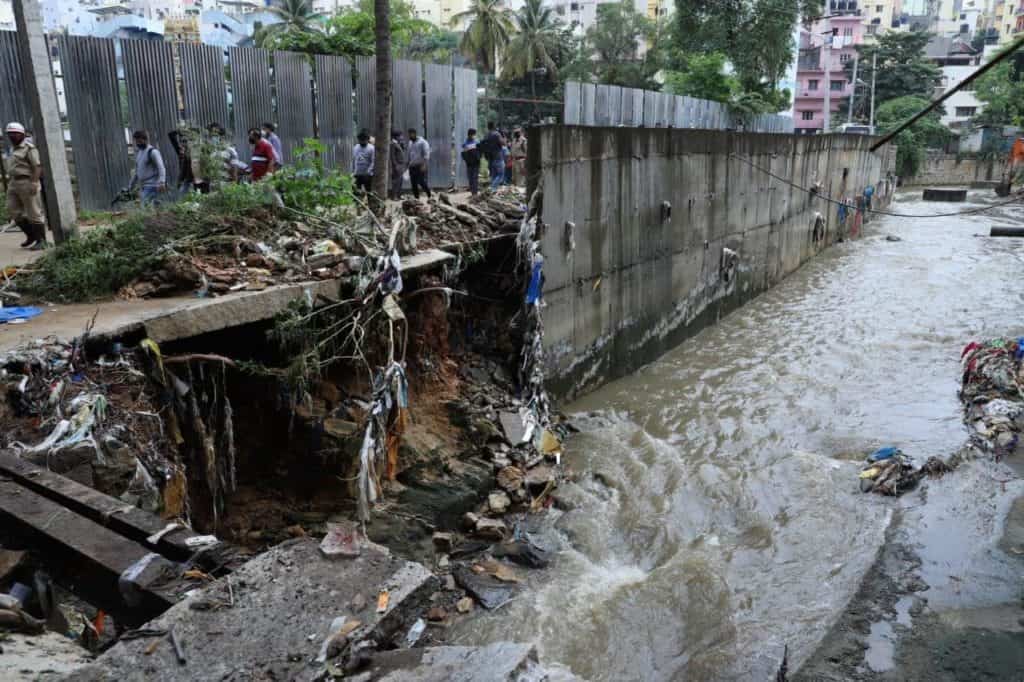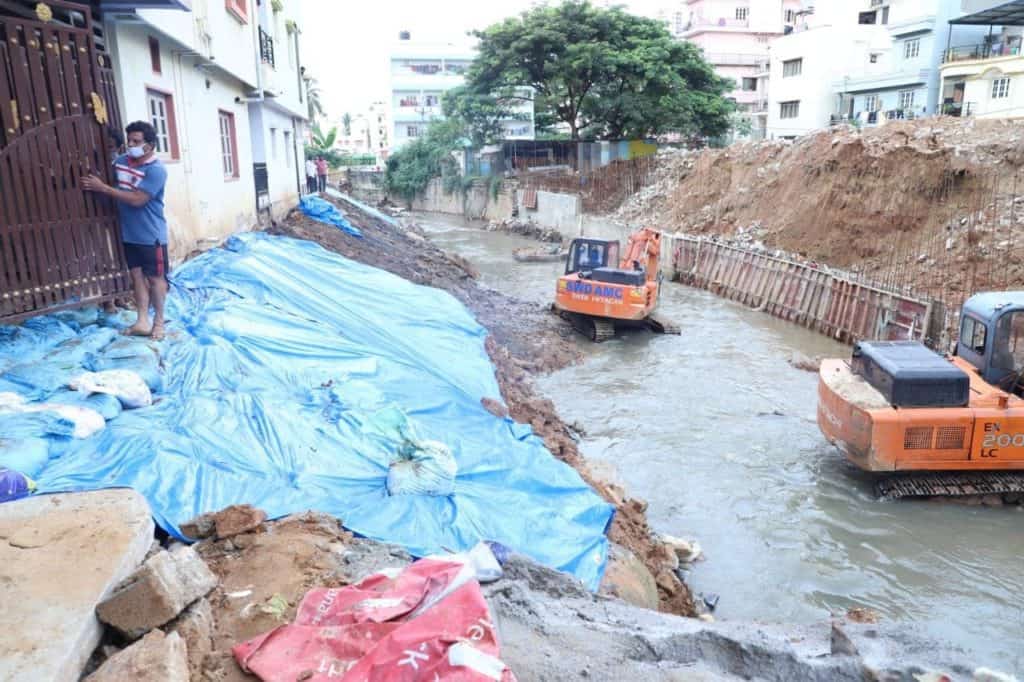
Towards October end, we saw heavy rains in different parts of Bengaluru – predominantly in the south and southwest – which led to flooding of many low-lying areas. Those rains have now given way to pleasant sunny days with partly-cloudy skies. It almost feels like winter is here.
How have the rains been this year? Flooding episodes in the last few months seem to indicate rains were in excess, but were they?
Rainfall was indeed in excess, but also erratic
The Long Period Average(LPA) annual rainfall for Bengaluru is 986mm as per the IMD (India Meteorological Department). (This is the city’s average annual rainfall, considering the years from 1981 to 2010.) The city usually receives over half of its total rainfall within just the three months of August, September and October.
This year, Bengaluru received 1121 mm rain from January 1 till October 29, way above the annual normal of 986 mm. Rainfall is already in excess by 21.5%. So, even with a dry November, Bengaluru would be in excess for 2020.
However, total rainfall tells only part of the story. Rains this year have been haphazard, logging excesses in most months and a major deficit in August.
| Month | Normal | Actual | Departure from Normal |
| March | 18.5 | 18.4 | – 0.5% |
| April | 41.5 | 121.1 | 191.8% |
| May | 107.4 | 128.6 | 19.7% |
| June | 106.5 | 114.8 | 7.8% |
| July | 112.9 | 158.3 | 40.2% |
| August | 147 | 75.9 | – 48.3% |
| September | 212.8 | 300 | 41% |
| October | 168.3 | 204.3 | 21.4% |
In August, a big monsoon surge coming in from the Arabian Sea had caused heavy rainfall around the coast and the Malnad regions. But this surge probably meant less rains that month for Bengaluru and for South Interior Karnataka in general.
Huge variances within city
Even within Bengaluru, rainfall has varied widely. Take June, for example. The IMD weather station in the city claims to have recorded only 114.8 mm that month – that is, just 7.8% more than the normal rain in June.
But on the evening of June 6, west and southwest Bengaluru were lashed with heavy rains. My rain gauge, near Bangalore University, recorded 109 mm that day alone. And the ones by KSNDMC (Karnataka State Natural Disaster Monitoring Centre) recorded rain in the range of 60-90 mm in different parts of southwest Bengaluru such as Kengeri, Jnanabharathi and RR Nagar.

Again, on June 25, west and southwest Bengaluru were in the centre of action. Kengeri, for example, recorded 185.5 mm! This rain was so heavy that the Vrishabhavathi river breached its embankment and overflowed onto Mysore Road near Mailasandra.
In July too, west and southwest Bengaluru recorded rain in excess of 200 mm, while the City IMD weather station had recorded only 158.3 mm. My rain gauge, near Bangalore University, for example, had recorded 218 mm.
With this kind of variance, the data from different private weather stations paint an interesting story. Girinagar, for example, has received total rainfall of over 1500 mm this year.
My own rain gauge, near Bangalore University, has recorded just under 1400 mm for the year. Areas around Yelahanka/Sahakarnagar in northwest Bengaluru have recorded around 1300 mm.
Quiet year for East Bengaluru while many other areas flooded
Variations in rainfall also mean that different areas were disproportionately affected by floods. In September, northwest Bengaluru had heavy rains with incidents of flooding, whereas south Bengaluru had a quiet month.
And conversely, while October brought much woes to south and southwest Bengaluru including the flooding of Hosakerehalli lake, north and northwest Bengaluru had a relatively quiet month. As per my rain gauge, the five days from October 19 to 24 brought in 250 mm, but I was spared the rain that deluged south Bengaluru on the evening of October 23.

And while many parts of Bengaluru have been drowning in excess rainfall, the east has had a relatively quiet year overall. Some weather stations in Whitefield have recorded less than 800 mm for the year, and some near Banaswadi around 900 mm. HAL IMD station itself has recorded 932 mm so far, 17% lower than the City IMD, and around 33% lower than the rainier parts of the city!
We are now into November, and can expect 40-50 mm more rain to top up our counts for the year. But for the best part, the big rains and floods are likely over for 2020.
As per IMD count, it can be called a “normal year”. But those who had their houses or basements flooded would disagree, and so would BBMP which had to deal with those floods, and also has to fix the Vrishabhavathi embankment. One hopes the embankment will stand for some years at least.

Whether we are seeing more erratic weather in recent years, or if these floods are the result of drainage mismanagement, or a combination of both, is hard to tell, and would need much more research into rainfall patterns.
Kaveri reservoirs have filled up
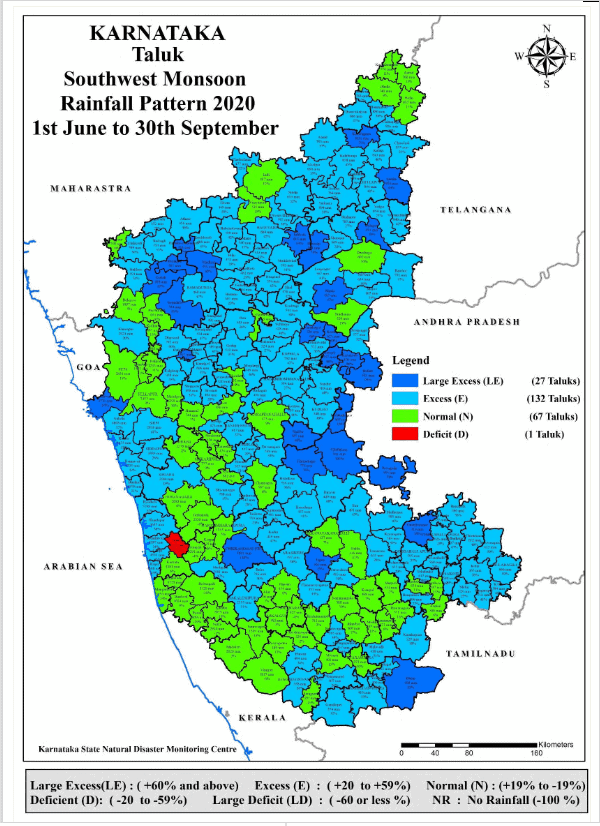
Like Bengaluru, Kaveri basin has also had what you can call a “normal” year. The Southwest Monsoon has been normal or in excess in all districts around the Kaveri Basin, from Kodagu to Chamarajanagara. Many of these districts have been dealing with excess rains.

It also helped that we started June with more than 40 tmc ft of water in all the Kaveri reservoirs put together, against a total capacity of 114 tmc ft. While the rains were mostly disappointing till the end of July, a monsoon surge in the first half of August helped us achieve another year with full reservoirs.

Bengaluru draws around 18 tmc ft of water annually from the Kaveri, so parts of the city that get water from the Kaveri can be without worry, till next monsoon at least. Most importantly, in a year that has thrown up a major health crisis, not having to deal with a water crisis is a big relief.
[The author would like to thank the https://twitter.com/bngweather team.]
[Disclaimer: This article is a citizen contribution and the analysis is based on public information. Any views expressed here are those of the individual writer(s) and do not reflect the position of Citizen Matters.]
Why only one district in the KA map is being marked in red as deficit? Is it due to data issue?? Logically it won’t make sense at all…
That is Hebri Taluk of Udupi. It has -21% rainfall. But the average rainfall there is pretty high at 5268 mm during the monsoons. It has received 4140mm, which is similar to the surrounding Taluks. Just that the average there is much higher than the surrounding Taluks. Not that much of an anomaly. If you look at Hobli levels there will be more areas that are red. As granularity increases there’ll be more nitpicking.