“There is no blanket figure given as daily COVID testing target,” says Rajendra Cholan, Special Commissioner (Health) at BBMP. “Testing numbers are decided based on a formula given by the state TAC (Technical Advisory Committee) for COVID”.
Even as the second wave hit its peak during April-May, Bengaluru urban clocked only around 30,000-40,000 tests per day, (it was 20,000-30,000 before the start of the second wave), despite experts recommending an increase in test numbers which perhaps could have identified and isolated asymptomatic persons quicker and reduced the spread.
Cholan added that it was not a question of randomly testing one or two lakh people per day. “The TAC had recommended that for every positive case, we have to trace and test 4-5 primary contacts. Also, a certain proportion of ILI/SARI (Influenza-like Illness/Severe Acute Respiratory Infection) cases should be tested daily. The state health department gives us the final target based on this formula”.
He added that the number of tests will go up if the number of daily cases increase. That did not happen at that time when the district was showing a big daily increase in case numbers. And now, with the second wave gradually abating in the district and test positivity rate over the past week being around 3%, Bengaluru is scaling down its triage centres and CCCs (COVID Care Centres).
But it is also now showing higher test numbers.
Health Department suggests only around 24,000 tests
Following is the document shared by Cholan on June 9, which shows the formula and corresponding target for each district.
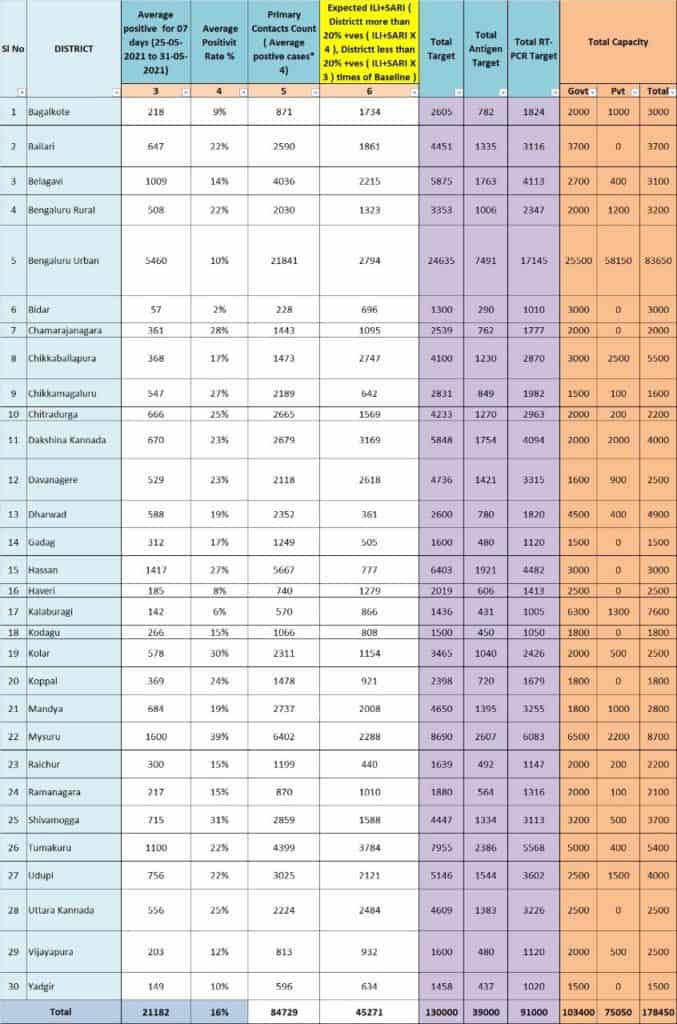
As per the formula, the health department’s target for Bengaluru Urban district is just 24,635 tests per day. This includes around 17,000 RT-PCR tests and around 7,500 antigen tests. (The target is even lower in some other districts. For example, Bidar has a target of just 1,300 tests per day. Bengaluru Rural district has a target of only 3,353 tests per day though it has had high positive and death numbers in the second wave.)
The table also shows that Bengaluru Urban district has the capacity to do 83,650 tests per day. Cholan however says that despite the low target, Bengaluru Urban district has been conducting 65,000-70,000 tests per day: “This is the highest testing number among all the metros now. With unlock, people from rural areas will return to Bengaluru. Hence we will maintain the same testing numbers”.

Read More: COVID lessons Bengaluru must learn from second wave
How will we know if a third wave is coming?
While we keep seeing numbers of daily tests, active case numbers, deaths, etc., how do we make sense of these numbers? Many state governments have been using test positivity rate (TPR) to communicate COVID trends. However, understanding the trend requires the use of a bunch of indicators, not just one.
Globally, different institutions and academicians have used varying indicators. For example, the US-based website Covid Act Now, in partnership with Harvard Global Health Institute, uses daily new cases, reproduction number and test positivity rate to understand the trend. But other US-based platforms have used death numbers, hospitalisation rates, etc., in combination with other indicators.
TAC member Dr Giridhar Babu says that last November, in their second wave advisory, the committee had asked the state government to track the growth rate of positive cases, reproduction number, testing rates and TPR. But under the changed second-wave scenario, the committee at a meeting on May 30, asked the government to track ICU admission rates, total cases and TPR. At the time, ICU beds were almost full in Bengaluru.
“ICU occupancy should be less than 50% ideally, to be guaranteed that the pandemic is under control,” says Dr Giridhar. “So one should look at several indicators to make an assessment”.
Following are some common indicators used to track COVID, and what they mean.
Daily positive cases
Daily positive cases is simply the number of COVID positive cases reported every day. TAC had recommended the government should track the growth rate of this indicator per week as tracking the growth rate of daily cases on a weekly or monthly basis shows the change in pattern over time. “If there are lot of cases, it’s better to check the weekly growth rate (since patterns can change quickly),” says Dr Giridhar. “If cases are fewer, it should be ok to check the monthly growth rate”.
Test positivity rate
TPR measures how prevalent COVID is among those tested on a particular day; it doesn’t show virus prevalence in the community. So, unlike what’s commonly believed, TPR alone can’t reveal the spread of COVID in the city. Rather, it only indicates if the city’s testing capacity is sufficient
For example, if only symptomatic people are tested, TPR is likely to be high as most of them are likely to be COVID-positive. This was the case during the peak of the COVID second wave in Bengaluru, when the administration decided to test only symptomatic people and the TPR went as high as 55%.
WHO recommends bringing TPR below 5%, which means many in the general population – both with and without COVID symptoms – have been tested. This would help identify asymptomatic patients sooner and treat and isolate them. Else, asymptomatic COVID patients get missed out even as their condition deteriorates and they infect others in the community.
Active cases
Active cases is the total number of COVID-positive cases at a particular time. Tracking the growth rate of active cases is important, says Mysore Sanjeev who heads the platform Jeevan Raksha which has been tracking COVID trends across the country including Bengaluru. “If active cases are increasing, it means the demand for hospital infrastructure is also increasing,” says Sanjeev. “So the authorities would have to look at hospital capacity, how many beds are vacant, etc, and make arrangements accordingly.”
Read More: These Bengaluru volunteers filled gaps in COVID management
Case fatality rate
CFR is the percentage of deaths out of the identified positive cases. CFR can tell how severe the disease is at a particular point, and how effective the treatment is on average.
Sanjeev says that tracking the CFR growth rate can help understand the cause for it, and find solutions. “For example, towards May end, Nanded in Maharashtra had a CFR of 53%. When looked at their data for May, we found this was because they were underreporting positive cases,” says Sanjeev. (CFR is deaths per 100 positive cases, so if fewer positive cases are reported, CFR will increase.)
While Bengaluru registered a high CFR a few weeks back, it has reduced of late. “The number of deaths reported was higher in the last few weeks because we were accounting for backlogs from the weeks before that,” said Cholan. “For example, on one day when close to 200 deaths were reported, the actual 24-hour deaths for the day was only around 60, if you see the data from crematoriums and hospitals. Now the number of reported deaths has reduced to around 50 per day”.
Reproduction number
Reproduction number indicates how contagious an infection currently is. It measures the average number of people a COVID patient can infect. For example, if the number is five, it means a COVID patient can infect five others on average.
“The moment this number goes above 1.5, the outbreak will be out of control,” says Dr Giridhar