Here is a drainage map of the city of Bengaluru sourced from the Central Ground Water Board website. No city sitting on a ridge line should actually get flooded but we have achieved the impossible — of course in parts.
A dotted ridge line divides the city between the Vrishabhavathy-Arkavathy-Cauvery basin and the Dakshina Pinakini, from the North to the South. There is a huge difference between these two in the slope, the hydro-geology, the soil, the rainfall, the built up area etc.
The drainage patterns – the rajkaluves – are interesting too. They are more dendritic in the Vrishabhavathy-Arkavathy-Cauvery basin and less so in the Dakshina Pinakini basin. Especially the North East of the city has a much flatter terrain and the slope and lake connections move West to East before they eventually join the Dakshina Pinakini and start sloping Southwards.
In the Western part of the city the slopes and hence the naalas – raj kaluves are more pronounced. During rains, water flows down streams more in the Cauvery basin while it gets collected and causes flooding more in the Dakshina Pinakini area.
The hydrogeology and hence the capacity of the aquifers to absorb water too is different in the two river basins. Groundwater is more abundantly available and the weathered zone hence recharge is better in the Cauvery basin than the Dakshina Pinakini basin. De-silted tanks should have better recharge in the Cauvery basin, while those in the Dakshina Pinakini will hold water longer and better.
Rainfall patterns too are incredibly localised as the tracking by the Karnataka State Natural Disaster Management Cell (KSNDMC) is showing us daily. Rain is more in the South and West of the city than the North and the East of the city, making the South and West more flood-prone than the North and the East.
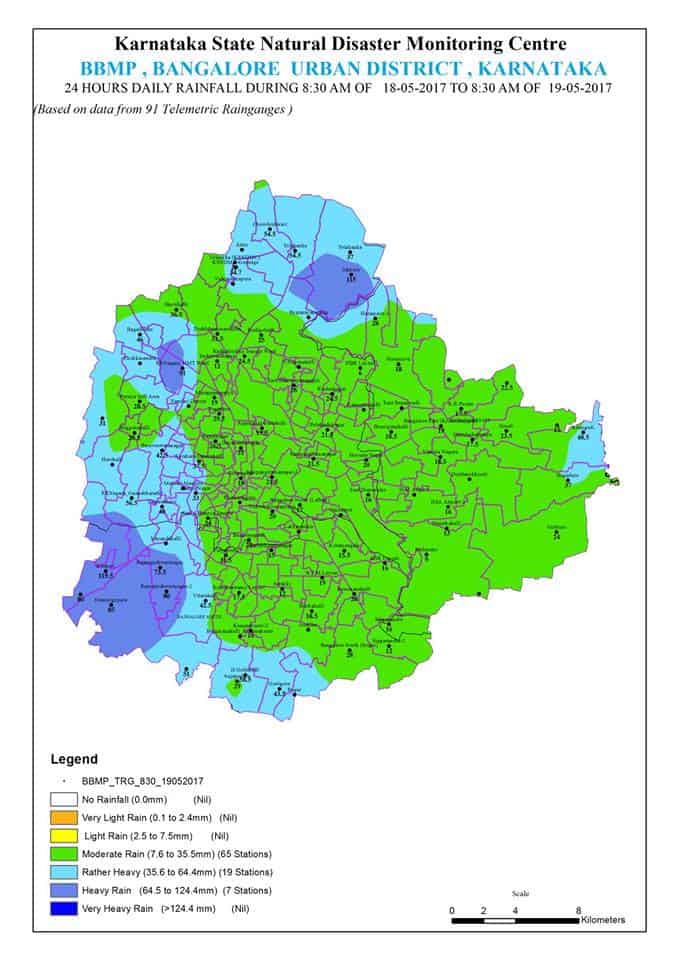
Thus, in reality there are many Bengalurus for rainfall. The IMD centre in the heart of the city has recorded 1655.70 mm of rainfall. The rain gauge on our office in a suburb to the North of Bengaluru in Vidyaranyapura has recorded only 1002.80 mm a staggering 65% variation.
When we map out the flood affected areas with the various typology it will be helpful and useful. Underpasses getting flooded, neighbourhoods getting flooded, streams overflowing , lakes overflowing are all different typologies.
Let’s look at the example of how construction activities change the landscape and drainage patterns.
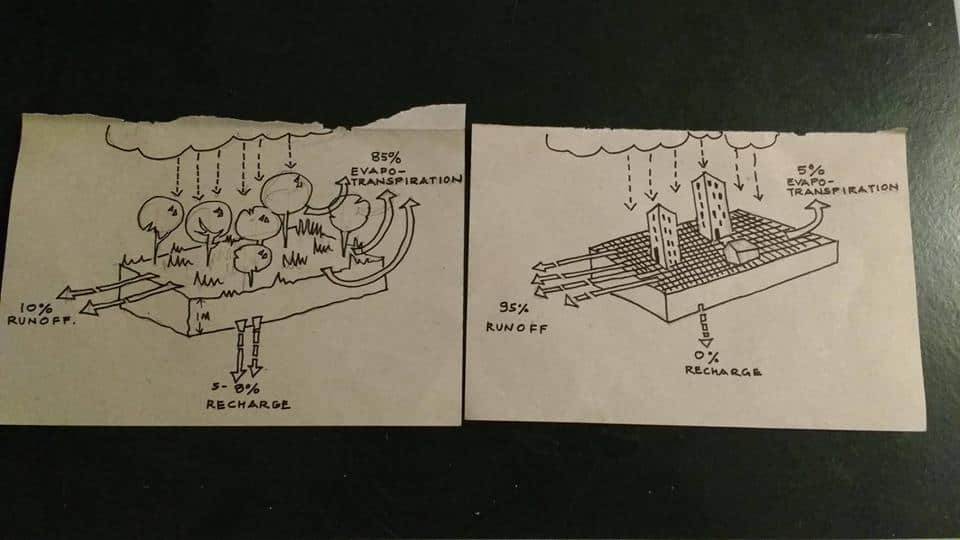
When a site is built up (assuming a flat site and normal rainfall in Bengaluru), a small one such as a 600 sq ft site, the hydrology of the site changes dramatically. From a run-off of 10 % it goes to 95 % or even 100 %. The big loser is soil moisture and evapotranspiration which, as expected, drops dramatically in an urbanised area.
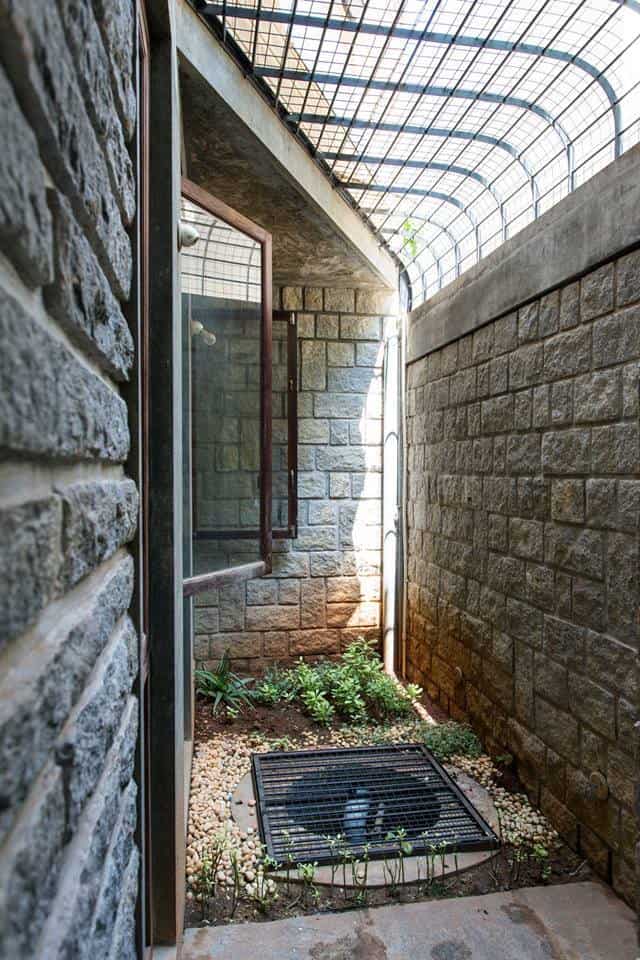
How do we reverse this? If every plot is made responsible for the stormwater that it generates i.e. by holding to or recharging into a well every drop of rain that falls on the site, it will prevent flooding.
However, this depends on the ability of the aquifer to hold and transmit water. Sometimes the recharge rate can be low, sometimes transmissivity can be low, sometimes the weathered zone may be very small.
Thus when each micro-watershed is understood separately and jointly with the river basin, flood prevention will be better and systematically done. It is time we put up a citizens effort to understand and manage floods and we do it with the KSNDMC.
Dear Sir,
Rain fed Victoria lake, which is a major source of Nile, is about 1000m above sea level bodering kenya, tazania and uganda. From 1000m high the river gradually falls to low lying areas and finally reaches Egypt and joins the sea.
Even in Karnataka there are many low lying areas where the water can be routed. For example, Mysore is at 700m and many more places well below 500m; whereas, bengaluru and places like Hassan are above 900m. So, here, after cathing water in a network of lakes during excess rains with the use of gravity can be routed to low lying water scarce areas in karnataka using small diversions.
One can find the height above sea level by hovering mouse over the desired region in the following web page:
https://maps.ngdc.noaa.gov/viewers/bathymetry/
Thanks and Regards
D Chandrasekhar
Can anybody share the map of flow of these rivers and tributaries?
1) Vrishabhavathy – Bubba Stream, which joins the main river from Kadu Malleswaram
2) Kumdavathy – The flow of this river from Shivaganage Hills till TG Halli
3) Suvarnamukhi river, which flows through Bannerghatta Road
Dear Sir,
Why is it that the older part of Bengaluru ie the Cantonment area has less flooding issues as compared to the City area? Rain water harvesting which is compulsory should be enforced by BWSSB.