Come June 5 and all eyes across the world will be on India, the global host of World Environment Day, 2018. A country with a recycling economy predominantly driven by informal waste-pickers, India has imposed a complete ban on plastic in several states so far, setting the stage for this year’s theme, “Beat Plastic Pollution”.
In March 2016, the erstwhile Plastic Waste (Management and Handling) Rules 2011 were replaced by the Plastic Waste Management Rules 2016, notified by the Ministry of Environment and Forest & Climate Change (MoEF&CC). This provides a regulatory framework for management of plastic waste by urban local bodies as well as the waste generators (individual household, institutions, residential and commercial establishments and defence establishments).
Some of the highlights of the central rules are as below:
The Plastic Waste Management Rule, 2016
Amendment (March 2018) The Amendment Rules lay down the phasing out of manufacture and use of multi-layered plastic which are non-recyclable or non-energy recoverable or with no alternative use. Further, the provision under the Parent Rules requiring shopkeepers and street vendors willing to provide plastic carry bags for dispensing any commodity to register with a local body has been omitted. |
However, while we do see and hear of restrictions on the use of plastic, since as early as the 1990s in fact, the country continues to reel under an unprecedented amount of Plastic Waste (PW) being dumped in landfills, strewn around, washed ashore and slowly making its way to the food chain.
Types of plastic material
Plastic materials are categorized into seven types based on their properties and applications. To make recycling easier, universally accepted standards have been developed to help consumers identify and sort out the main types of plastics with marking code.
The classifications or categories defined by the Plastics Industry Association, adopted as IS 14534:1998 of BIS, are as follows:
| Serial Number | Name of Plastic | Source Code | Few Applications | Recyclable? |
| 1. | PET
Polyethylene Terephthalate (PET) |
1 | Drinking water Bottles, Soft
drink Bottles, Food jars, Jars for jelly, pickles etc., Plastics Films, Sheets |
Easily recyclable. |
| 2. | HDPE/LDPE
High Density Polyethylene (HDPE) Low Density Polyethylene (LDPE) |
2 & 3 | Plastics bags, Food
containers, woven sacks, Bottles, Plastics Toys, Milk Pouches & Shopping Bags, Metalized Pouches |
HDPE- Most commonly recyclable plastic as it does not break under exposure to extreme heat and cold.
LDPE- Recyclable but not all recycling facility have the option to recycle LDPE. |
| 3. | PVC
Polyvinyl Chloride (PVC) |
4 | Pipes, Hoses, Sheets, Wire,
cable insulations, Multilayer Tubes |
Least recycled. Called ‘poison plastic’ as it contains toxins. |
| 4. | PP
Polypropylene (PP) |
5 | Disposable Cups, Bottle caps,
Straws |
Can be recycled but difficult. |
| 5. | PS
Polystyrene (PS) |
6 | Disposable Cups, glasses,
Plates, spoons, trays, CD Covers, Cassette Boxes, Foams |
No. It breaks easily making it harmful to the environment. Found on beaches all over the world. |
| 6. | OTHER
Thermoset, Poly Carbonate (PC), Poly urethane (PU) FRP |
7 | CD, Melamine Plates,
Helmets, Shoe soles. |
No |
Plastic ban scenario across India
As many as 18 states across India have imposed a blanket ban on single use plastic. Following is the country map showing states that have imposed a complete ban on single use plastic (in green) and states with partial ban on single use plastic (in red).
The ban is for manufacture, usage, transport, distribution, wholesale and retail sale and storage, import of plastic bags with handle and without handle, and disposable products manufactured from plastic.
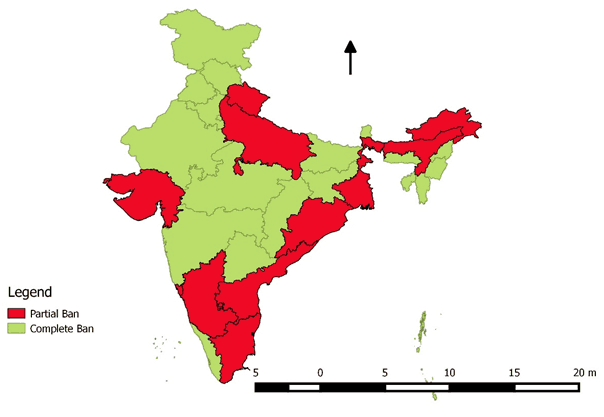
Status of plastic ban across various states
The urban footprint
Despite rules in place and amendments being made from time to time to keep plastic waste in check, anti-plastic policies have witnessed limited success.
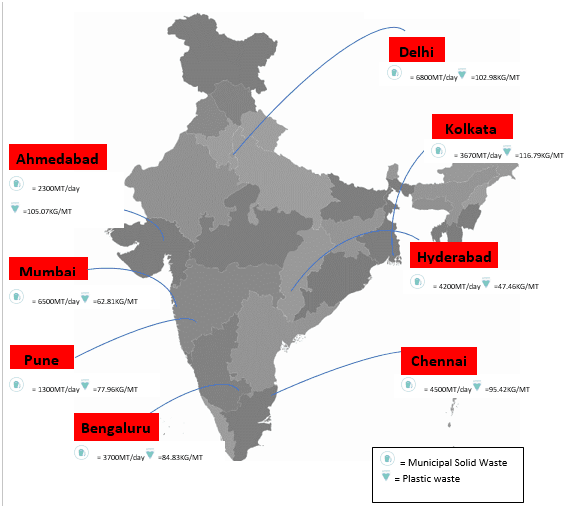
A study – Assessment and Quantification of Plastic Waste Generated in 60 Cities – published by the Central Pollution Control Board (CPCB) in 2015-16 reveals that there is little or no processing of either Municipal Solid Waste (MSW) or plastic waste or PW in most Indian cities and the metropolises, barring Ahmedabad and Pune, to some extent. According to the study, it is dumped at the disposal site, following the method of crude dumping, where the waste is neither spread nor covered.
Across eight metro cities, Kolkata led the way with 116.79 kg of PW per MT (Million Tons) of total Municipal Solid Waste (MSW), MSW on an average per day, followed by Delhi (102.98kg/MT of MSW) and Ahmedabad (105.07kg/MT of MSW). While no post treatment operation of MSW or PW was performed in either Delhi or Kolkata, Ahmedabad was placed better with efforts being taken to treat organic waste and reduce MSW in landfills using a gas-based power plant.
A graphical presentation of total PW and MSW generated by Indian metropolises as per the CPCB report.
On track to (mis)management
As per the CPCB report, here is how major cities across the country manage their PW.
The overall plastic waste scenario in the respective states as cited in the annual report 2015-16 of the CPCB is also mentioned, as are the rules or guidelines with respect to use of plastic in these states.
Delhi
- On an average, Delhi generates 102.98kg/MT of PW daily. Total MSW of the city stands at 6800MT/day.
- No post-treatment operation of MSW is carried out and it is dumped as land filling.
- Over the duration of the study, approximately 200-250 rag pickers were found to be voluntarily collecting the valuable plastic waste that was generated throughout the day.
- In addition, a compost fertilizer plant having a capacity of about 500MT was established in the city, but currently the plant produces an output of about only 200 MT.
Chennai
- Chennai generates 4500MT/day of MSW, WITH 95.42kg/MT of PW.
- MSW does not undergo any post treatment operation.
- Around 84% of HDPE/LDPE waste consists of carry bags, milk pouches and packing films.
Tamil Nadu generated approximately 1,50,323 tons of PW during the year 2015-16. There are 301 registered and 112 unregistered plastic manufacturing/recycling units and five compostable units in the state. During 2015-16, approximately 26.8 tons of PW were used for road construction in the state.
There is a partial ban on plastic carry bags in the state.
Bangalore
- Bangalore generates about 3700MT of MSW per day. Average PW generated by the city is 84.83kg/MT of MSW.
- Around 93% of the total PW is from HDPE/LDPE/LLDPE.
The total PW generated in Karnataka during 2015-16 stands at approximately 1,29,600 tons/annum. As many as 205 ULBs perform source segregation of waste. The state has imposed a complete ban on use of plastic carry bags and 167 ULBs have fixed prices for carry bags to be provided by shopkeepers and vendors.
Hyderabad
- Total MSW generated in the city is 4200MT/day. Average PW out of this is 47.46kg/MT.
- About 63.21% of PW was obtained from HDPE/LDPE material.
- MSW collected from various location are transported to the Jawaharnagar dumpsite where 50 families of ragpickers segregate PW and sell it to re-processors.
Total PW generated in Telangana during 2015-16 was about 1,20,961 tons/annum. The state has as many as 195 registered and 15 unregistered plastic manufacturing/recycling units.
Ahmedabad
- A total of 2300 MT/day of MSW is generated, with average PW of 105.05kg/tons.
- Of total PW, 88% comes from HDPE/LDPE material.
- Organic waste is treated separately to manufacture organic fertilizers
- A gas-based power plant is also situated at the site which reduces the total quantity of MSW used in land-filling.
- Composting is done to reduce the quantity of waste going to landfills.
At the state level, the estimated plastic waste generation in Gujarat is approximately 2,69,294 tons/annum. There are 689 registered plastic manufacturing/recycling units and nine multilayer plastic units. Approximately 52,746 MT of plastic waste is co-processed in cement plants.
The use of plastic carry bags is completely banned in the city of Gandhinagar.
Explicit pricing of carry bags has been implemented by a few Urban Local Bodies (ULBs). Marking and labelling provisions, mentioned under PWM Rules, 2016 are followed by most of the manufacturers present in the state.
Mumbai
- Total MSW generated was 6500MT/day. Average PW in the total MSW stood at 62.81kg/MT.
- Dumpsites have huge number of rag pickers, collecting polybags, PET bottles, sacks, milk pouches, rubber & foam slippers etc.
Pune
- Average total PW generated in Pune, also in Maharashtra, was 77.96kg/MT.
- About 95% of total PW comes from HDPE/LDPE materials.
- Total MSW of the city is 1300 MT/day.
- MSW collected from 85 wards of Pune city are transferred to four transfer locations, before being transported to the Fursungi Processing Plant.
- Currently, all MSW are post treated to produce products like plastic recycled granules, sand, refused derived fuel and compost fertilizer.
Maharashtra generated approximately 4,69,098 tons/annum of PW during the year 2015 -16. The state recently imposed a complete ban on use of plastic carry bags and disposable products manufactured from plastic and thermocol.
Kolkata
- Kolkata generates about 3670MT of MSW per day. Out of this, average PW generated per day is 116.09 kg/MT.
- About 88.7% is from HDPE/LDPE material
There are about 71 plastic manufacturing/recycling units in West Bengal polymer bitumen roads have been constructed by many municipalities. There is a ban on paper on the use of plastic carry bags in ecologically fragile areas and certain heritage and tourist places.
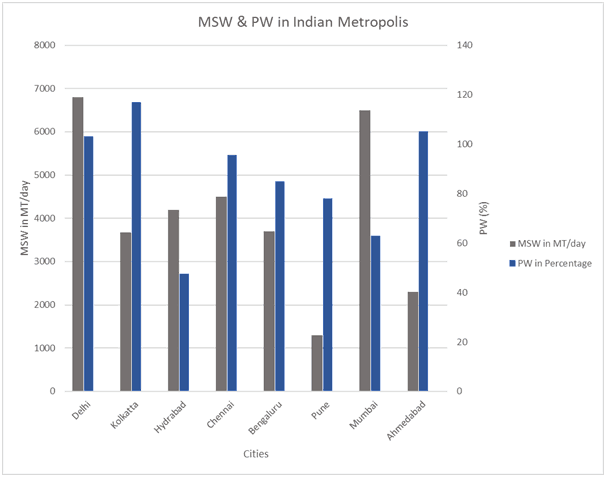
A graph showing MSW and PW (%) at all eight metropolises.