During a question and answer session in Delhi late last year, I was asked this question “Since Diwali, the Delhi government has installed 20 continuous monitoring stations. Despite that, why are the pollution levels still so high?”
The simple answer to this is that monitoring is a diagnostic tool to assess levels of air pollution and in itself does not reduce any air pollution. What it does do, is provide a starting point for understanding the air pollution problem and a direction for addressing pollution control options.
This however got me thinking. Having worked on air pollution-related research over my entire career, I often unwittingly assume that others also understand the concepts related to air pollution as I understand them. This bias tends to be reinforced when speaking to other “experts” and the only way to break out of this bias is to communicate as clearly as possible to people.
There are several topics within air pollution that should be explained – such as source apportionment, dispersion modelling, emissions inventory, and the like – but in this discussion I will focus solely on “air pollution monitoring”. What purpose does it serve? Is ambient monitoring the same as emissions monitoring? How does one monitor? How do “low-cost” monitors fit in?
What is Air Pollution Monitoring?
Monitoring is an exercise to measure ambient levels of air pollution in an area. The results of this indicate the status of the quality of air we breathe. Monitoring data, over a long term, is especially useful as it allows us to tease out patterns that help support air pollution control policy.
These patterns include, spatial differences in pollution (which areas of the city are more polluted) and temporal differences (is there a pattern of pollution levels during a day and/or a year). So, while air pollution monitoring itself does not reduce air pollution, it gives us clues as to where the pollution is coming from and its level.
It is because monitoring informs air pollution policy, that it is often cited as an integral part (if not the key measure) of pollution control strategy by policy makers, and by extension, the media. For example, here is an article from 2016 in the Hindustan Times that says, “The mobile air quality monitoring unit will be capable of real-time sampling, analysis and control of air pollution from sources.”
For the uninitiated, this statement can be misleading, as it could be read that the mobile unit will make rounds of the city and “control” air pollution by sucking up pollution.
The pollution samples can be chemically analyzed to determine contributing sources. The chemical analysis allows us to estimate how much of the pollution is a result of various fuels such as petrol, diesel, coal, biomass, waste, or dust, which can be statistically matched to ascertain the source contributions such as vehicular traffic, crop burning, power plants and so on.
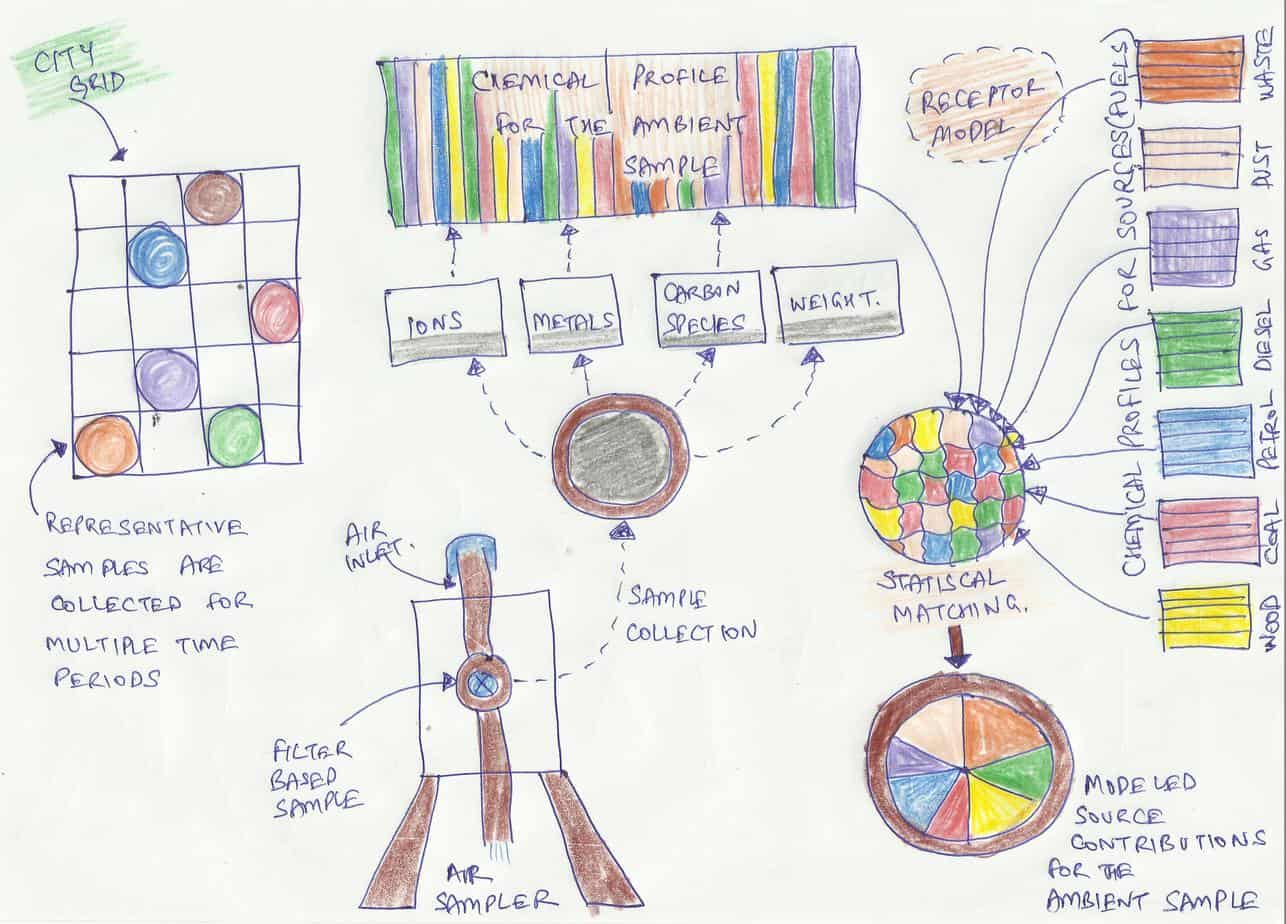
Armed with this information, we can then control the level of pollutants in the air by reducing emissions at those sources – vehicle tail pipes, dust on the roads, construction sites, diesel generator sets, industries small and large, domestic and commercial cooking, space heating, water heating, open waste burning, and open biomass burning. Hence monitoring can be compared to a diagnostic tool that informs the course of action (the treatment) carried out through policy and implementation.
How does one monitor air pollution?
Monitoring is the generic term used for methods to assess the level of air pollution. There are several types of monitoring, different ways of collecting this information, and multiple uses of this information.
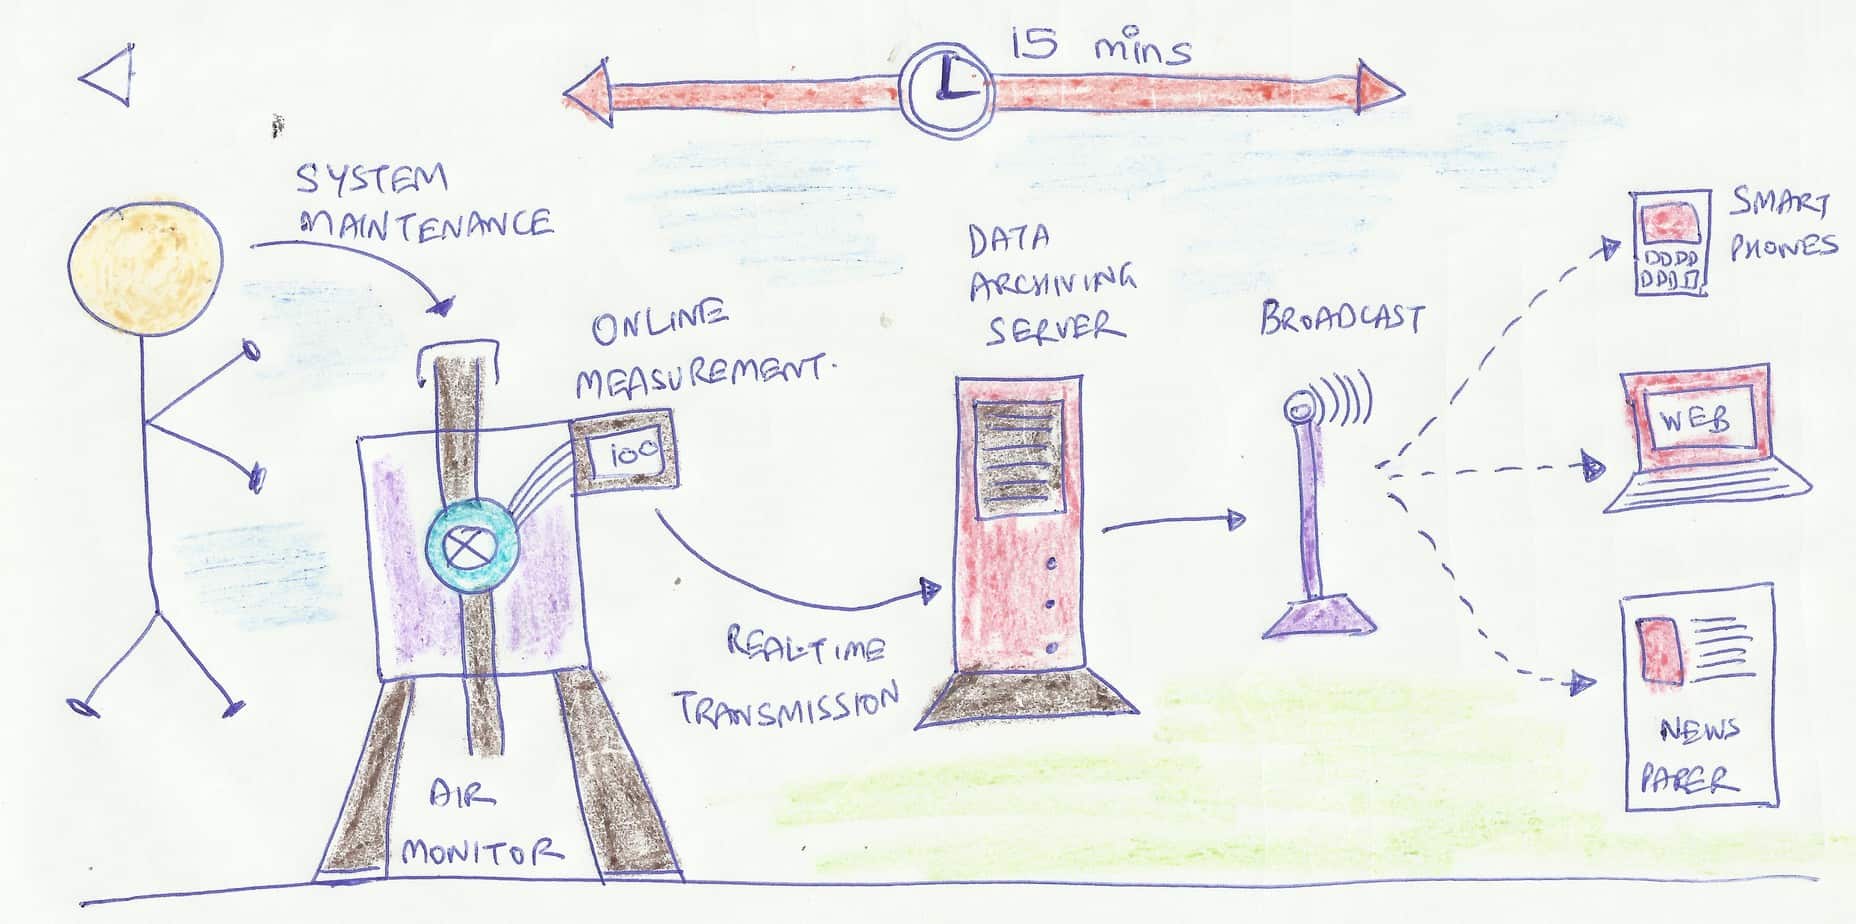
How continuous ambient air quality monitoring system works

How manual ambient air quality monitoring system works
Ambient Monitoring
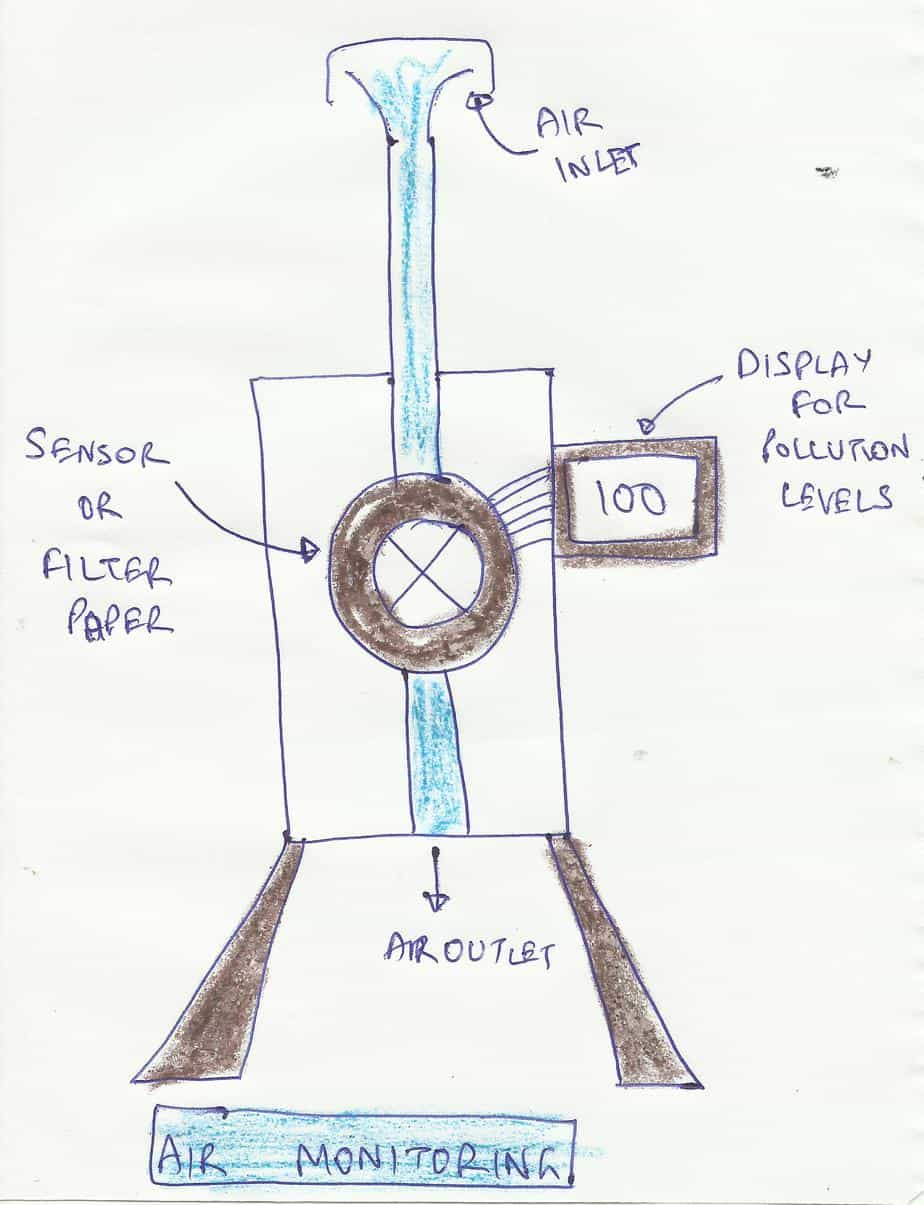
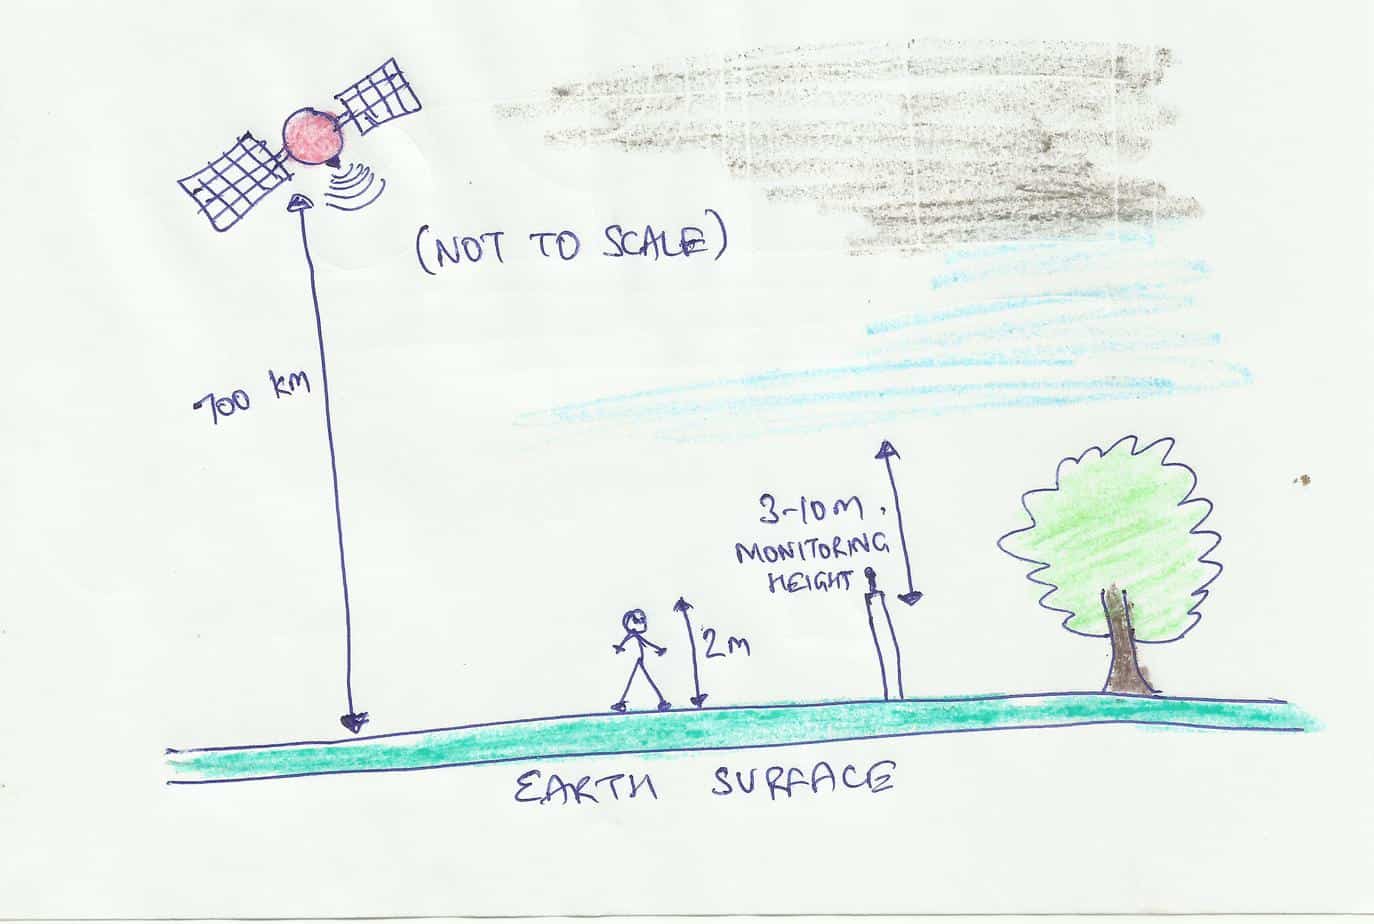
For air pollution measurements, ambient is all the air under 10m (roughly), at which point the vertical mixing is homogeneous and representative of all the sources in the vicinity (including pollution coming from long distance – neighboring village, city, state, or even country). This is a proxy for the general level of air pollution for an area.
According to ambient monitoring protocols proposed by the Central Pollution Control Board (CPCB, New Delhi, India), a station is to be located 3-10m from the ground and not at “ground zero”. This is to make sure that all source contributions at that point are represented, and there is no bias due to a single source that can influence the monitoring results – for example, overestimation of the pollution levels due at “ground zero” due to direct vehicle exhaust emissions.
There can also be biases associated with site selection that can influence measurements – a site that is too close to the industrial estate, or a site bang in the middle of a residential area, a site obstructed by surrounding trees, or a site too close to the traffic junction.
Thus the proper protocol for installing monitoring stations is that they should be off the ground (between 3 and 10 meters) and there should be multiple monitors at different sites, representing all areas of a city.
If long-term planning is the goal, then the ambient stations must run constantly over a period of time (with proper maintenance, calibration of machines, and quality control checks), so that the resulting data can provide a representative picture of spatial trends of pollution in cities, while also providing diurnal (within the day) and seasonal (within the year) trends in air pollution levels.
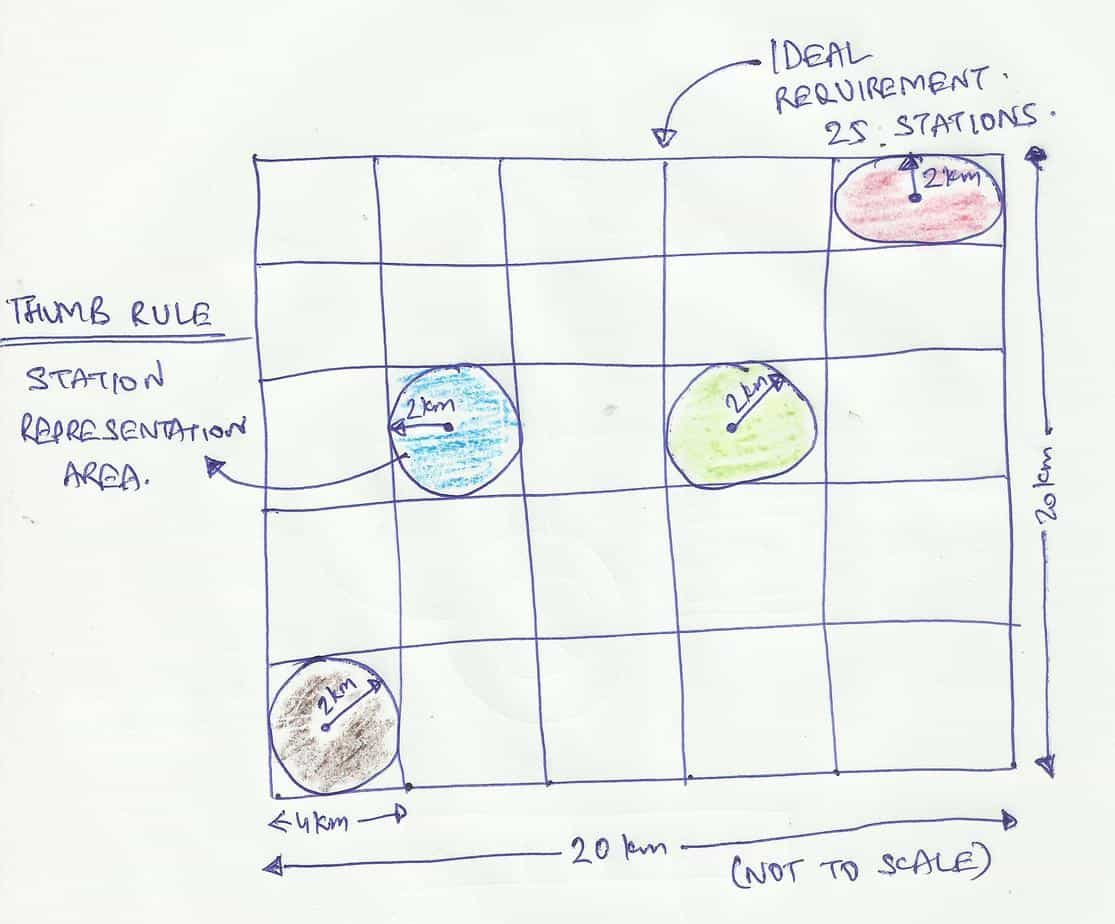
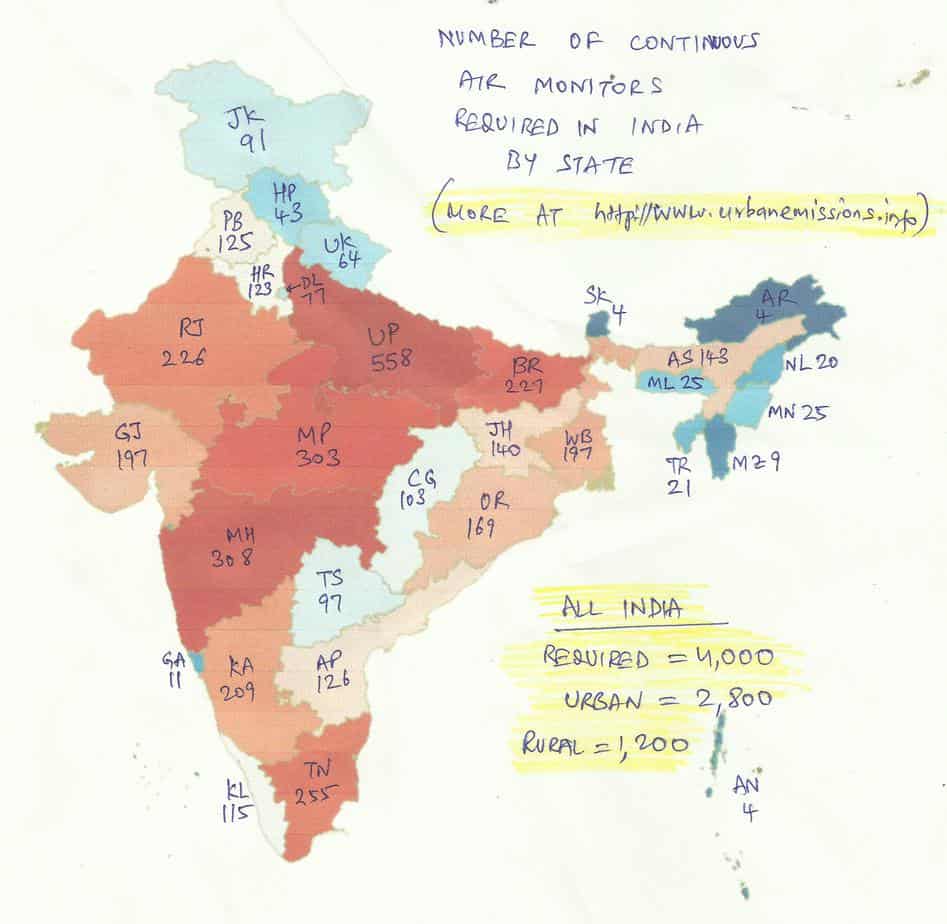
A general understanding is that an ambient monitoring stations can represent an area covering 2 km radius, which translates to 15 sq.km (rounded off). If the city size is 1,000 sq.km, then you need 67 stations spread across the city. In addition, we must also consider population density, the range of industrial activities, and local land use, which will further determine the required number of stations.
Using a thumb rule created by CPCB, which considers the total population of the airshed and the mix of activities, we estimate a need for 4,000 stations in India – 2,800 in the urban areas and 1,200 in the rural areas.
Mobile Monitoring
When this term is used, especially by pollution control boards (PCBs), this is referring to a van equipped with the same instruments as a regulatory-grade ambient monitoring station. When needed, this can be taken out, parked at the site under audit, and run for a day or a week or more, to collect ambient monitoring data for all the criteria pollutants.
The flexibility of the station to relocate between sites is what makes it mobile, but the measurements taken from the unit are considered ambient, since the unit stays put, at a pre-selected spot, to take long-term measurements.
On-road Monitoring
Often in the literature, words like “on-road” and “mobile” are discussed interchangeably, referring to the fact that the measurements are conducted when the instruments are in motion.
Strictly speaking, in on-road monitoring, all the instruments are strapped inside (or on) the vehicle and driven to measure on-road pollution levels. If this exercise is repeated for long periods and in multiple modes (cars, buses, cycle, motorcycle, and walking), we can establish a heat map of pollution on the roads.
It is very important to note that measurements collected from this exercise are biased towards sources on the road and one land use (roads) in the city. Therefore, by design, data obtained thus cannot be compared to that from the ambient monitoring stations or to the ambient standards. However, this exercise is complementary, which can help create a better understanding of the amount of pollution travelers are exposed to.
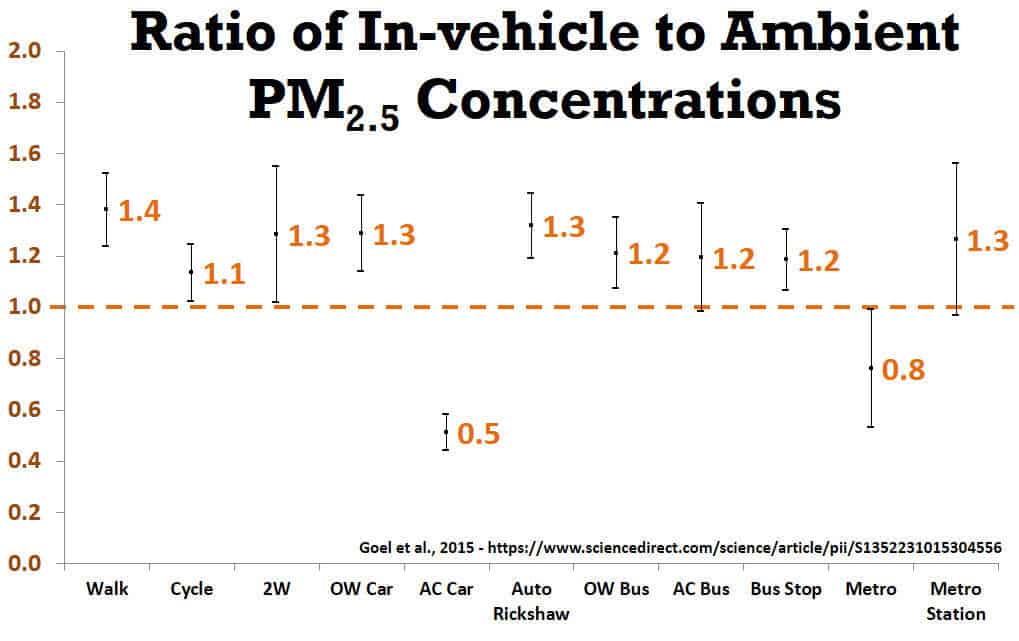
For example, the above graph presents a summary of exposure rates while traveling in various modes in Delhi (this study was conducted by the staff and the students at TRIPP center, Indian Institute of Technology, New Delhi, India).
In simple terms, one could say, if the city’s daily average ambient pollution is 100 μg/m3, the traveler on the roads is exposed to 20-30% more pollution (on average per day). This comparison makes sense only between averages of ambient and averages of on-road measurements.
Satellite Monitoring
Satellite monitoring is a multiple-step procedure that involves estimating pollution levels using a modelling exercise based on multiple assumptions.
The assumptions include on-ground measurements from ambient air monitoring stations, and results of a global chemical transport model that itself is based on estimated emission inventories. Hence for accurate estimates from satellite monitoring, data from on-ground monitoring stations are crucial.
For example, NASA MODIS satellite, is the most commonly used data feed for aerosol optical depth assessments; it is used to estimate global PM2.5 concentrations. This satellite orbits at 705 km and takes 99 minutes in the polar orbit to go around the earth.
A newer model is the ESA Sentinel series, which orbits at 693 km. In short, we have snapshots (when the image is cloud free) of aerosol optical depth over India, taken in a matter of seconds, to determine what the pollution levels are for that day. These snapshots tell a fascinating story, but not enough to understand the true diurnal and seasonal cycles of the on-ground pollution levels in India.
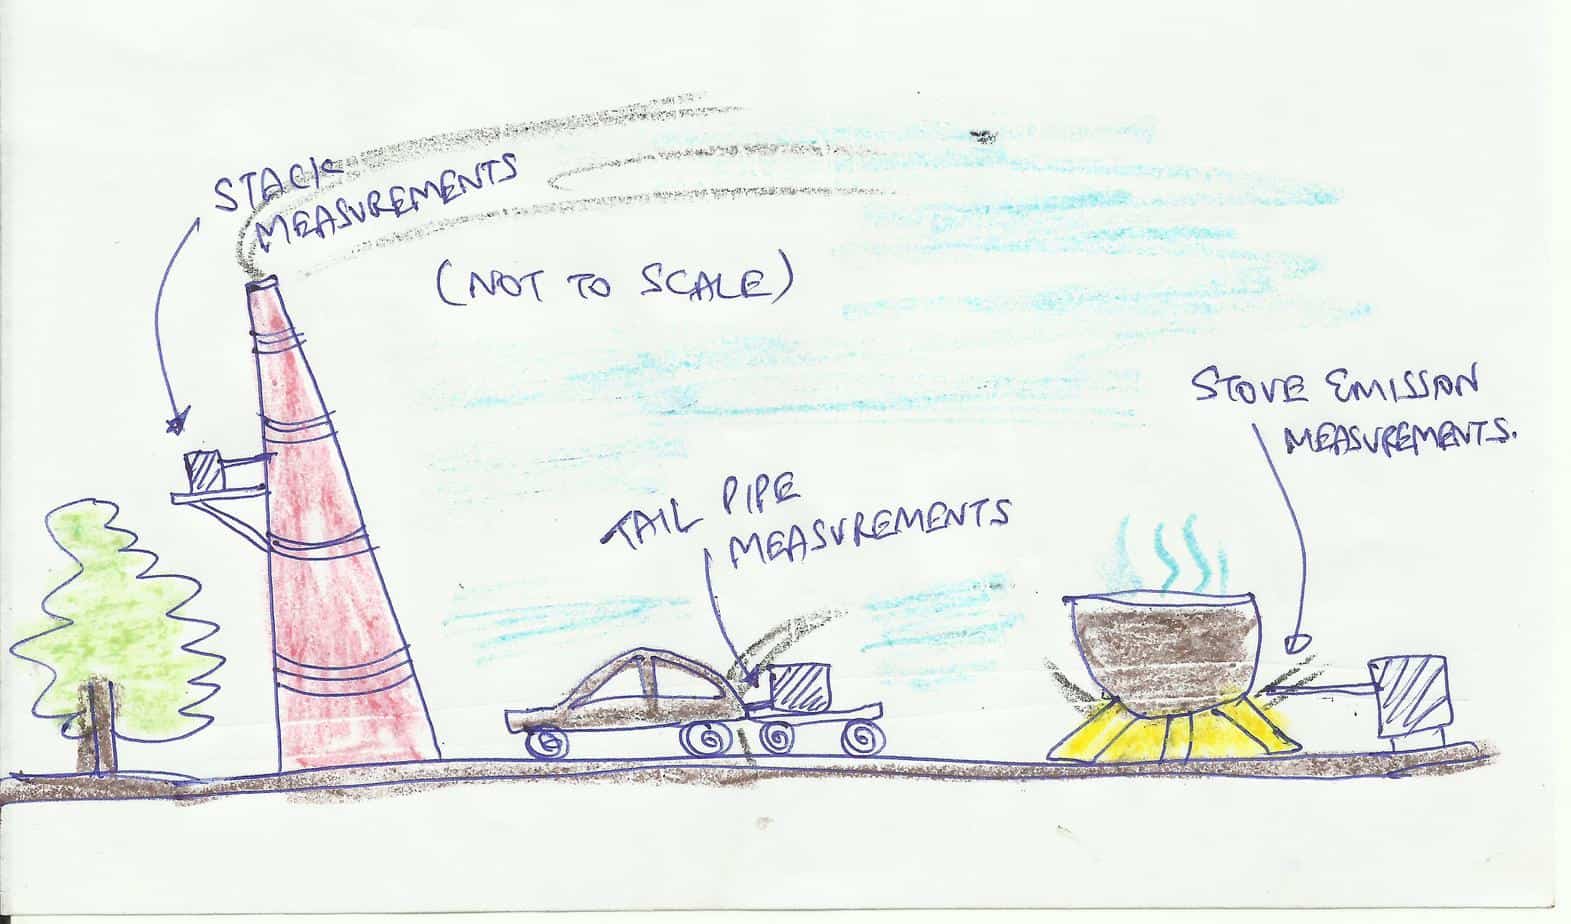
Emissions Monitoring
Ambient pollution is what we breathe and this should not be confused with emissions at the sources. When we stick a probe into a tailpipe or into an industrial chimney and start taking measurements, the monitor will say that the emission rate is XX g/m3 – this is an instantaneous value of emissions out of the tail pipe or the stack. Only after this amount disperses and mixes with other sources do we have an ambient air pollution value.
Like ambient air standards, there are emission norms for most of the sectors. For example, every car, van, and jeep, gets a “pollution under control” (PUC) sticker, which means that the vehicle emissions are under the prescribed norms for that pollutant. But when you have one million vehicles running on the same roads, at the same time, the compound effect is different.
Similarly for industries. Every industry is required to apply for an environmental clearance but the process does not include analysis for collective pollution loads in the industrial estate; only for the individual plant. There is a mandate for heavy industries to monitor air pollution at the stacks in real time. However, this information is not open for scrutiny or for use in research (for unknown reasons).
Again, we have vehicles with Bharat-III or IV stickers (and soon Bharat VI, starting with Delhi), but the true emission rate of a vehicle is determined by its age, usage and the roads it travels on. Thus it needs to be tested using a representative driving cycle for individual cities.
While we want to understand how much we are breathing and which pollutant, in order to better understand how much of that pollutant is coming from which source, we also need to invest in emissions monitoring.
Low-cost Monitoring
Low cost monitors have become a popular alternative to government monitoring data and has the potential to increase the pool of monitoring data. In general, these alternative sensors can help create a faster and cheaper heat map of the pollution levels in the city; can help reach the parts of the city, which are not possible to reach using standard monitors; and supplement that an expanding regulatory grade network in any city.
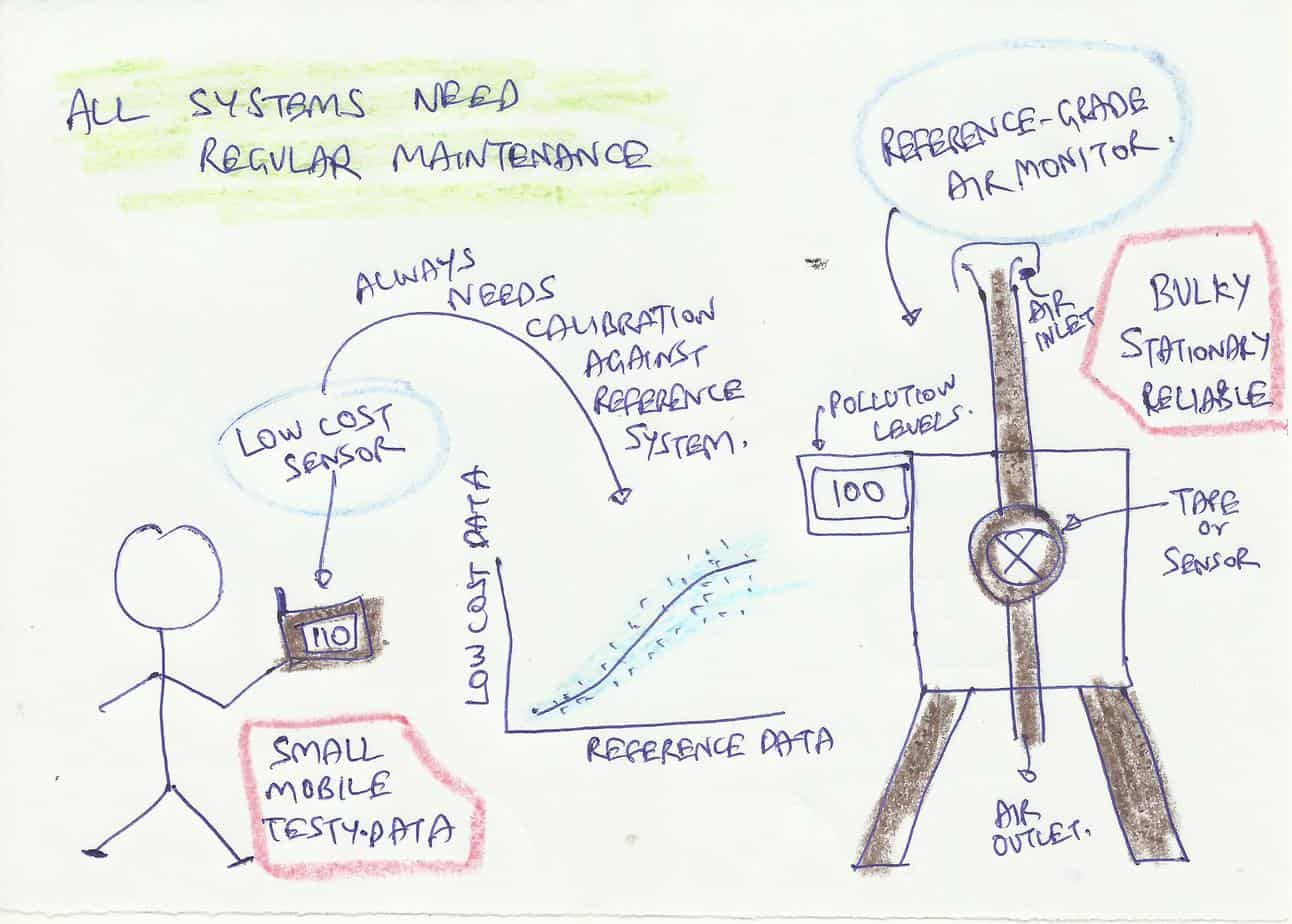
However, if the data is meant to support long-term air quality management plans for the city, this data should be analyzed with caution, and utilized only if the equipment passes the required calibration and maintenance protocols. If un-calibrated or not used correctly, the readings will be biased and more importantly will not be accepted by policymakers as a diagnostic.
Why monitor at all?
The most basic usage of monitoring data is summarized below.
| Focus Areas | Usage | |
| Ambient monitoring | The whole city or state or country | Data is used for long-term spatial and temporal trend analysis; can be used to determine the merits and the de-merits of an intervention over time |
| On-road (mobile) monitoring | Confined to roads and their immediate vicinity | Data is used for understanding pollution exposure during commute; specially to understand the acute health impacts of being exposed to augmented pollution levels on the roads |
| Satellite monitoring | The whole city or state or country | Data is used mostly for annual scale pollution trend analysis |
| Emissions monitoring | A specific source | Data is used to establish the emission rate by source, by fuel, by technology, and by usage |
Health impacts are the primary reason for worrying about deteriorating air quality. One of the biggest uses of a reliable ambient air monitoring data is to establish a credible nexus with health impacts, which range from cases of ischemic heart disease (which can lead to heart attacks), cerebrovascular disease (which can lead to strokes), chronic obstructive pulmonary diseases, lower respiratory infections, and cancers (in trachea, lungs, and bronchitis).
There is also growing evidence linking air pollution with obesity, diabetes, and Alzheimer’s disease. According to the recent global burden of disease (GBD) estimates, in 2016, estimated premature deaths are 1,030,000 due to outdoor and 780,000 due to household PM2.5 pollution. Similar estimates were published by Indian researchers as well, which were categorically rejected by the Environment ministers, on multiple occasions.
The only way to better understand the impact of air pollution on our health is by understanding the chronic pollution exposure levels. Unfortunately, like ambient monitoring and emissions monitoring in India, the work involved in understanding the chronic and acute health impacts on urban and rural population is lacking. The current understanding on how air pollution effects human organs, is based on studies conducted outside India. That shouldn’t be the reason to assume immunity to air pollution.
More studies linking health impacts and air pollution will strengthen the case for stricter regulations and aggressive implementation of cleaner options in India, but let us not stop or wait till that happens.
[This is an abridged version of a post by the author first published on Urbanemissions.info The detailed version can be read here. All doodles and images are taken from the original post.]